Google Search Console (GSC) is a free SEO tool from Google that every blogger and marketing team should have in their arsenal. It helps you monitor your website’s presence in Google Search, offering valuable insights into how your site is performing and what you can do to improve it. In this step-by-step guide, we’ll walk you through exactly how to use Google Search Console – from the initial setup and verification to leveraging its data for boosting your SEO strategy.
Whether you’re a solo blogger looking to grow your audience or a marketing team aiming to improve your company’s search rankings, this tutorial will help you unlock GSC’s full potential in a friendly, easy-to-follow way.
Why Google Search Console Matters for SEO
Google Search Console is like your site’s report card on Google. It shows how Google views your website and gives you the tools to fix problems and optimize your content. Here are just a few things GSC lets you do:
- Monitor search performance: See how many people find you on Google (clicks and impressions), what keywords they use, and your average position in search results.
- Submit sitemaps: Tell Google about all your site’s pages so they get crawled and indexed faster.
- Fix indexing issues: Get alerted to pages that Google had trouble indexing (like error pages or blocked content) so you can fix them.
- Inspect URLs: Check any page on your site to see if it’s indexed, and request indexing for new or updated content.
- Check Core Web Vitals: Track important user experience metrics (like page load speed and stability) that affect your SEO.
- View backlinks and internal links: See which sites link to you and how your internal linking is structured.
- Receive alerts: Get notified about security issues or manual penalties that could harm your search presence.
In short, GSC is essential for understanding and improving your SEO. And the best part? It’s completely free and easy to use once you know your way around. Let’s dive into setting it up and making the most of its features.
Analyze your domain's health score and fix all issues with a single click.

Step 1: Setting Up Google Search Console for Your Website
First things first – you need to add your website to Google Search Console. If you haven’t done this yet, don’t worry; it’s a quick process. Here’s how to get started:
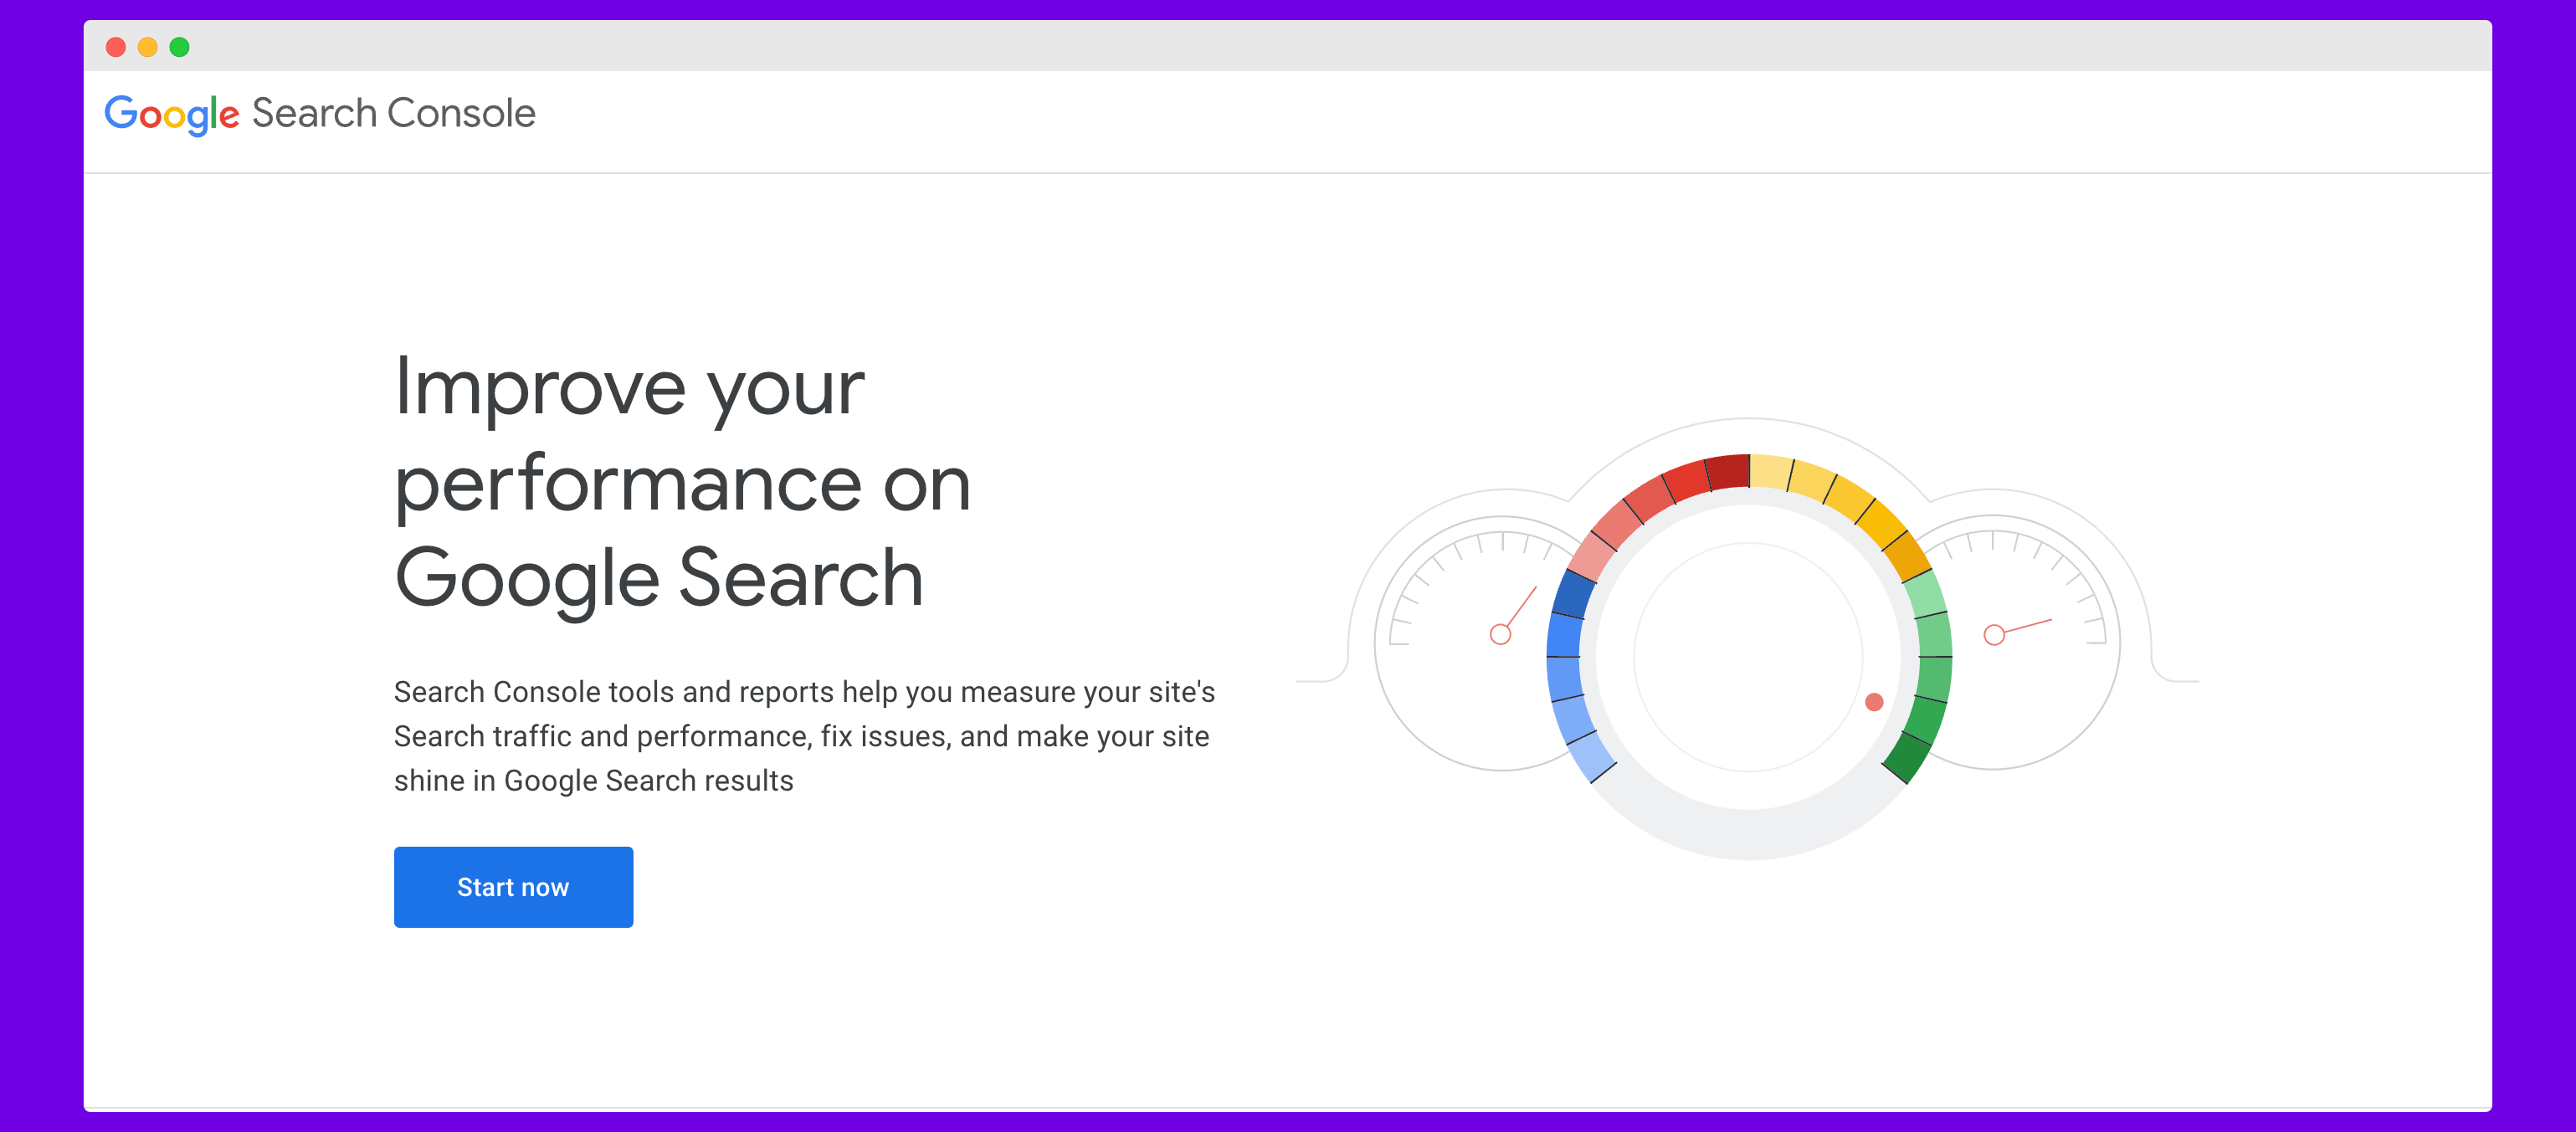
- Go to the Google Search Console website (search for “Google Search Console” or go to search.google.com/search-console). Log in with your Google account (the same one you use for Gmail or Google Analytics).
- Once logged in, you’ll see a welcome screen prompting you to “Add property.” Click the “Add Property” button.
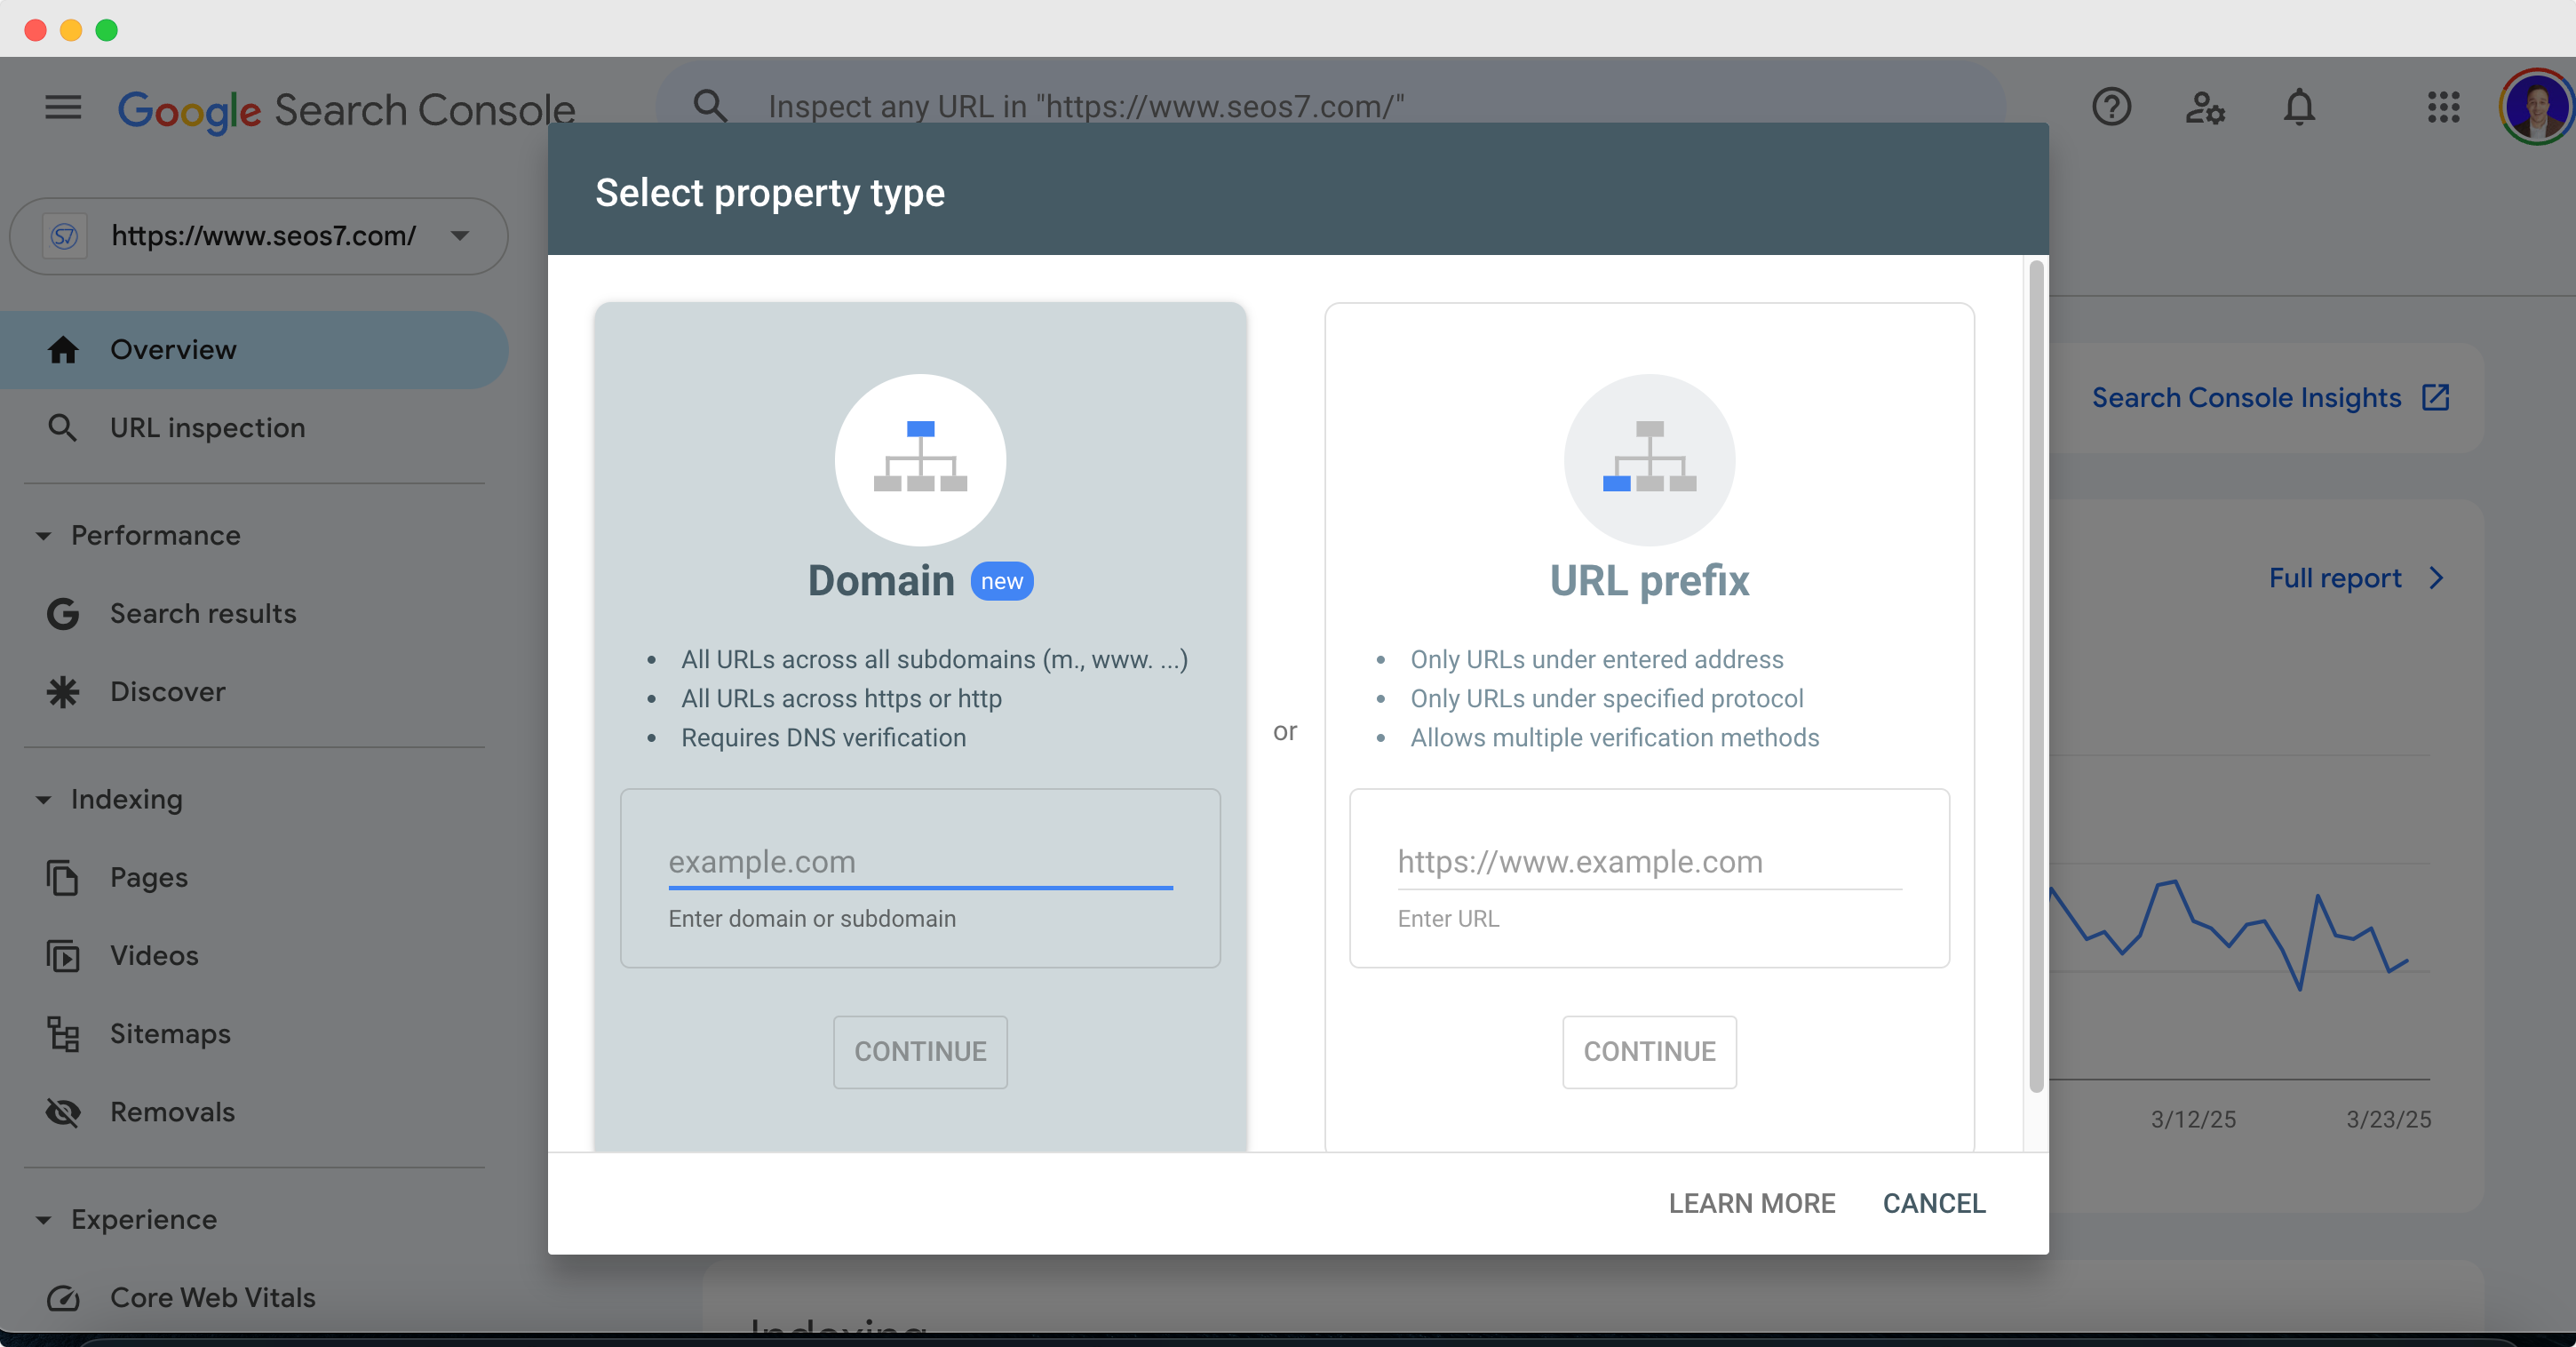
- Enter your website URL. You have two options here:
- Domain property – This covers your entire domain (including all subdomains and http/https versions). For example, entering
example.comwill coverhttp://example.com,https://example.com,blog.example.com, etc. Google recommends this option for a complete view of your site. - URL prefix property – This covers only a specific URL prefix (exactly as typed). For example,
https://www.example.com/blogwould track only the blog section. Use this if you want to track a specific subsection or if you can’t do domain verification.
- Domain property – This covers your entire domain (including all subdomains and http/https versions). For example, entering
- Click “Continue.” Google will now prompt you to verify that you own the site (we’ll cover verification in the next step).
Tip: If possible, choose the Domain property option to get all data for your domain. If you’re not comfortable with DNS verification (required for domain properties), you can use the URL prefix option for easier verification methods. You can always add both types to be thorough.
Step 2: Verifying Your Website Ownership in GSC
After adding your site, you must verify that you own it (or have the right to manage it). Verification is Google’s way of ensuring only authorized people can access a site’s search data. The steps vary slightly based on the property type you chose:
- If you added a Domain property: Google will give you a DNS TXT record to add to your domain’s DNS configuration.
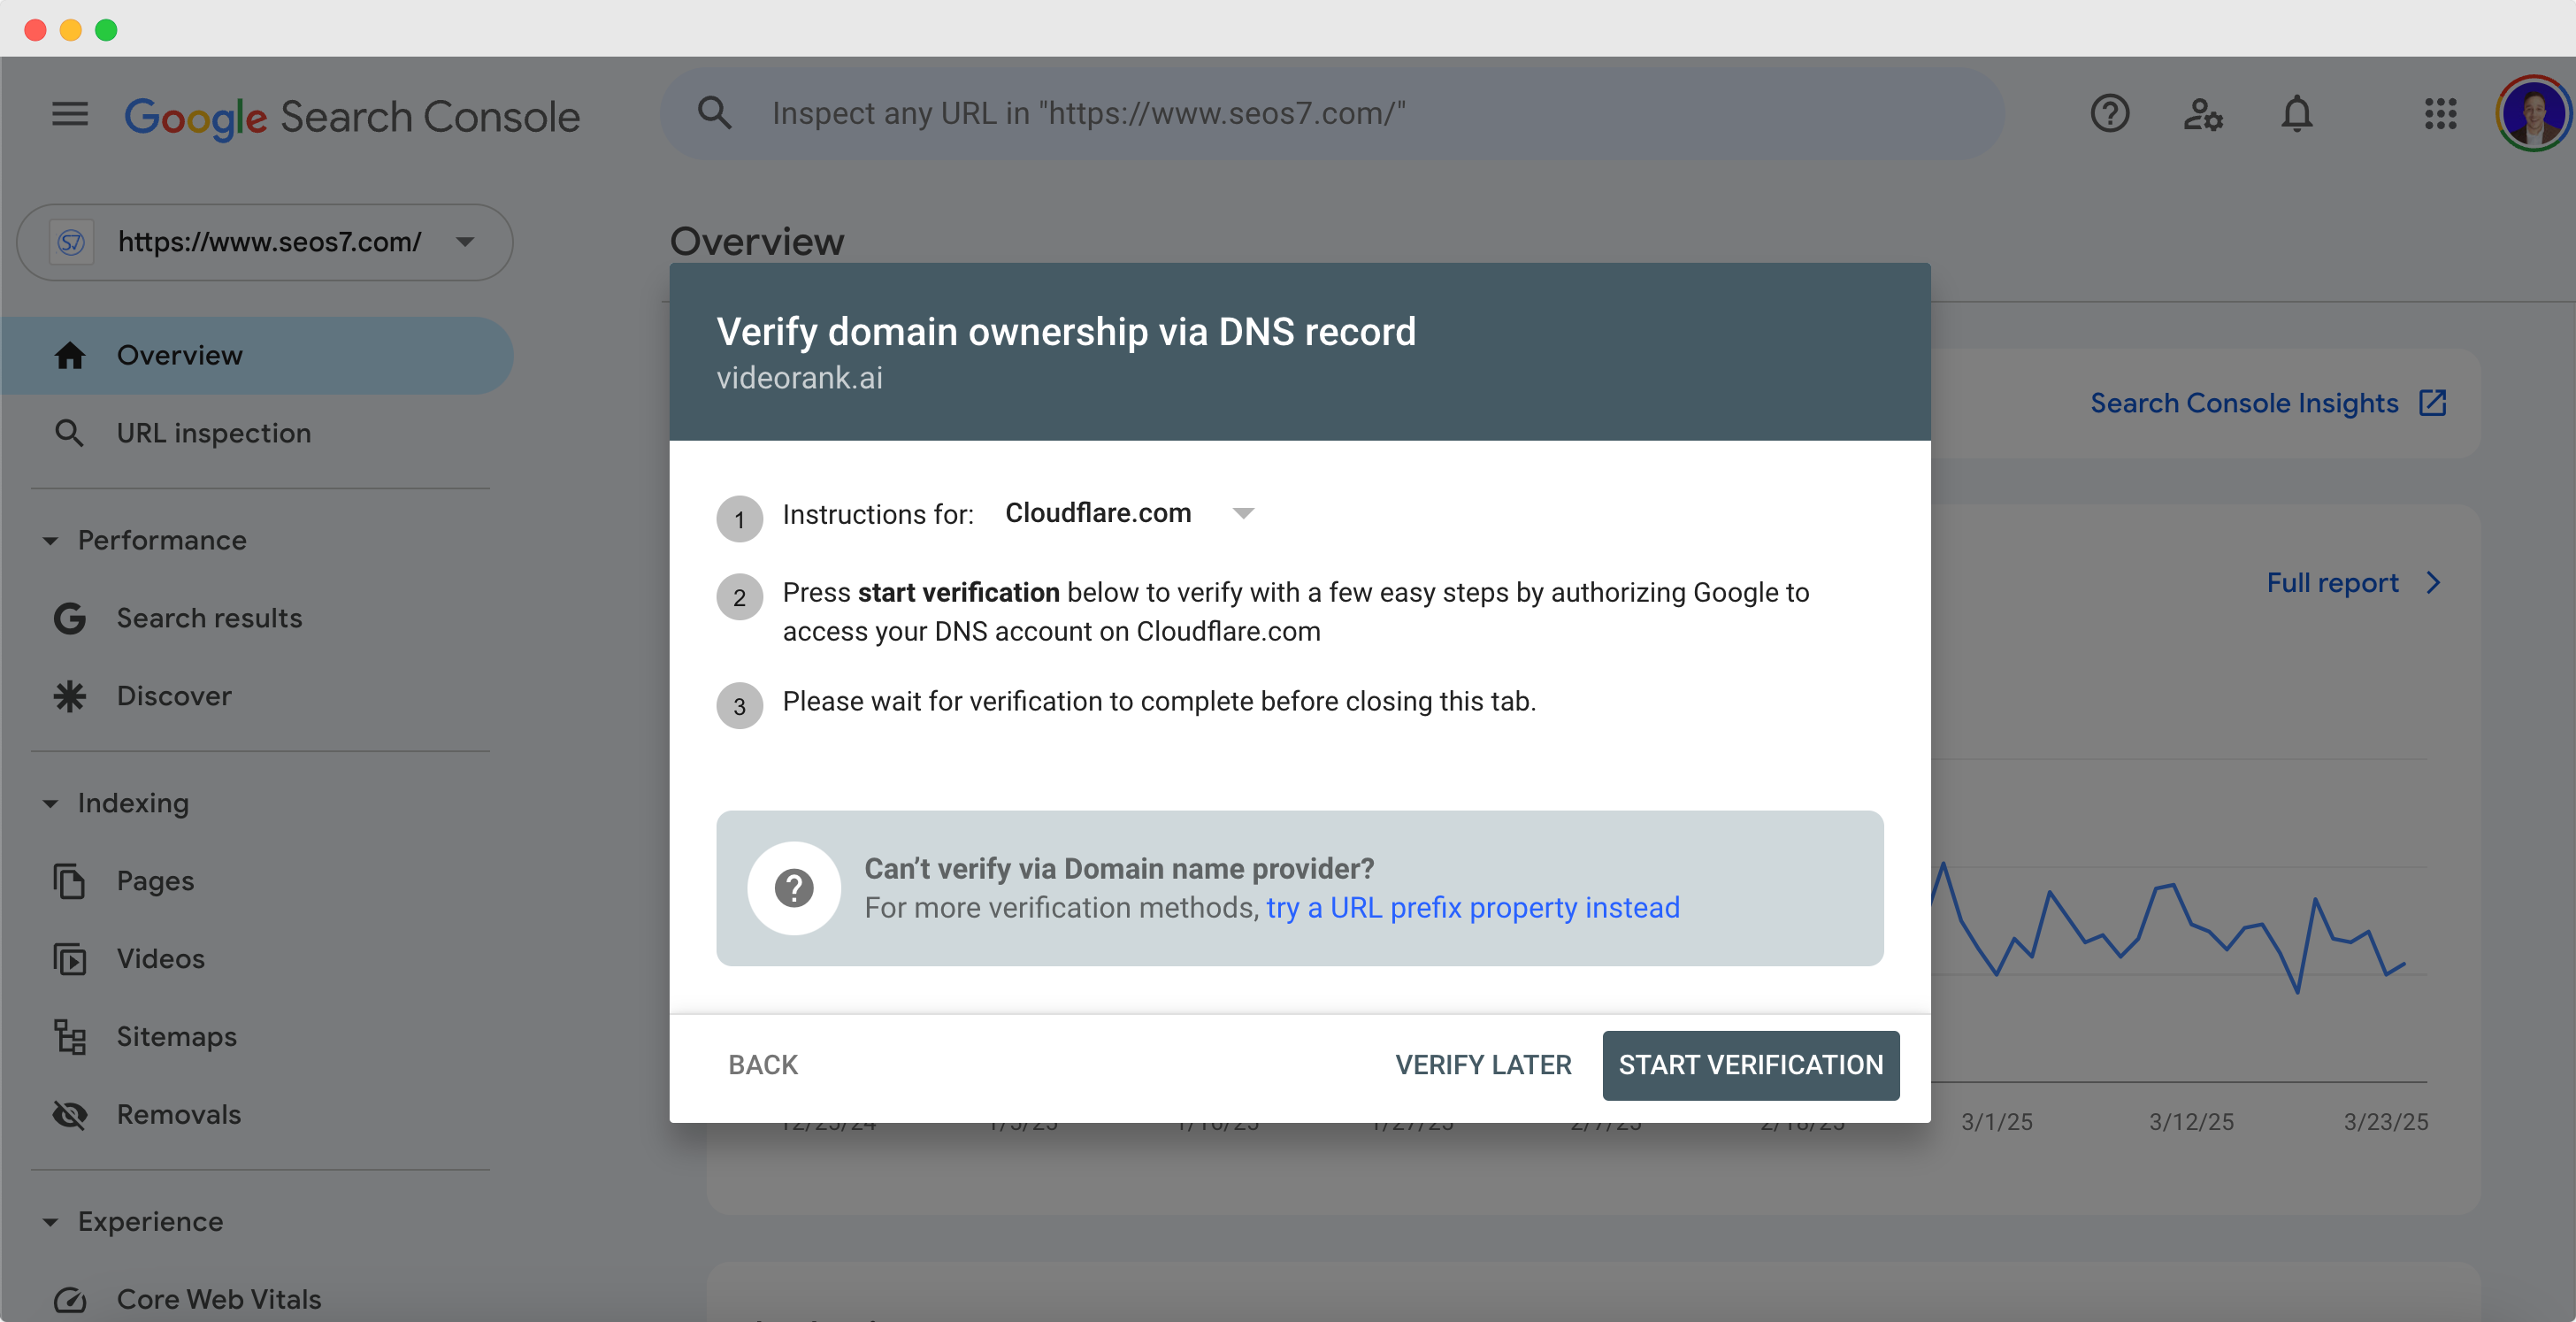
- Copy the unique TXT record provided (it will look like a string of letters/numbers).
- Login to your domain registrar or DNS provider (where you manage your domain records – e.g., GoDaddy, Namecheap, Cloudflare).
- Find the DNS settings for your domain and add a new TXT record. In the name/host field, enter
@(or your domain name), and in the value field paste the record Google gave you. - Save the DNS record. Note: DNS changes might take a few minutes to an hour to propagate.
- Back in Search Console, click “Verify.” Google will check for that TXT record to confirm you added it. If it hasn’t propagated yet, you can try again in a bit. Once found, your domain property will be verified!
- If you added a URL prefix property: You have multiple verification options. Select one of the following:
- HTML file upload: Download the HTML verification file Google provides and upload it to the root directory of your website (e.g., via FTP or your file manager). Once uploaded (at something like
https://yourwebsite.com/googlefffffffffff.html), click “Verify” in GSC. - HTML meta tag: Copy the meta tag code Google gives (it looks like
<meta name="google-site-verification" content="...">) and paste it into the<head>section of your site’s homepage HTML. For many bloggers on WordPress, this is easy – you can paste it using an SEO plugin (like Yoast’s webmaster tools section) or in your theme’s header file. After adding the tag, go back to GSC and click “Verify.”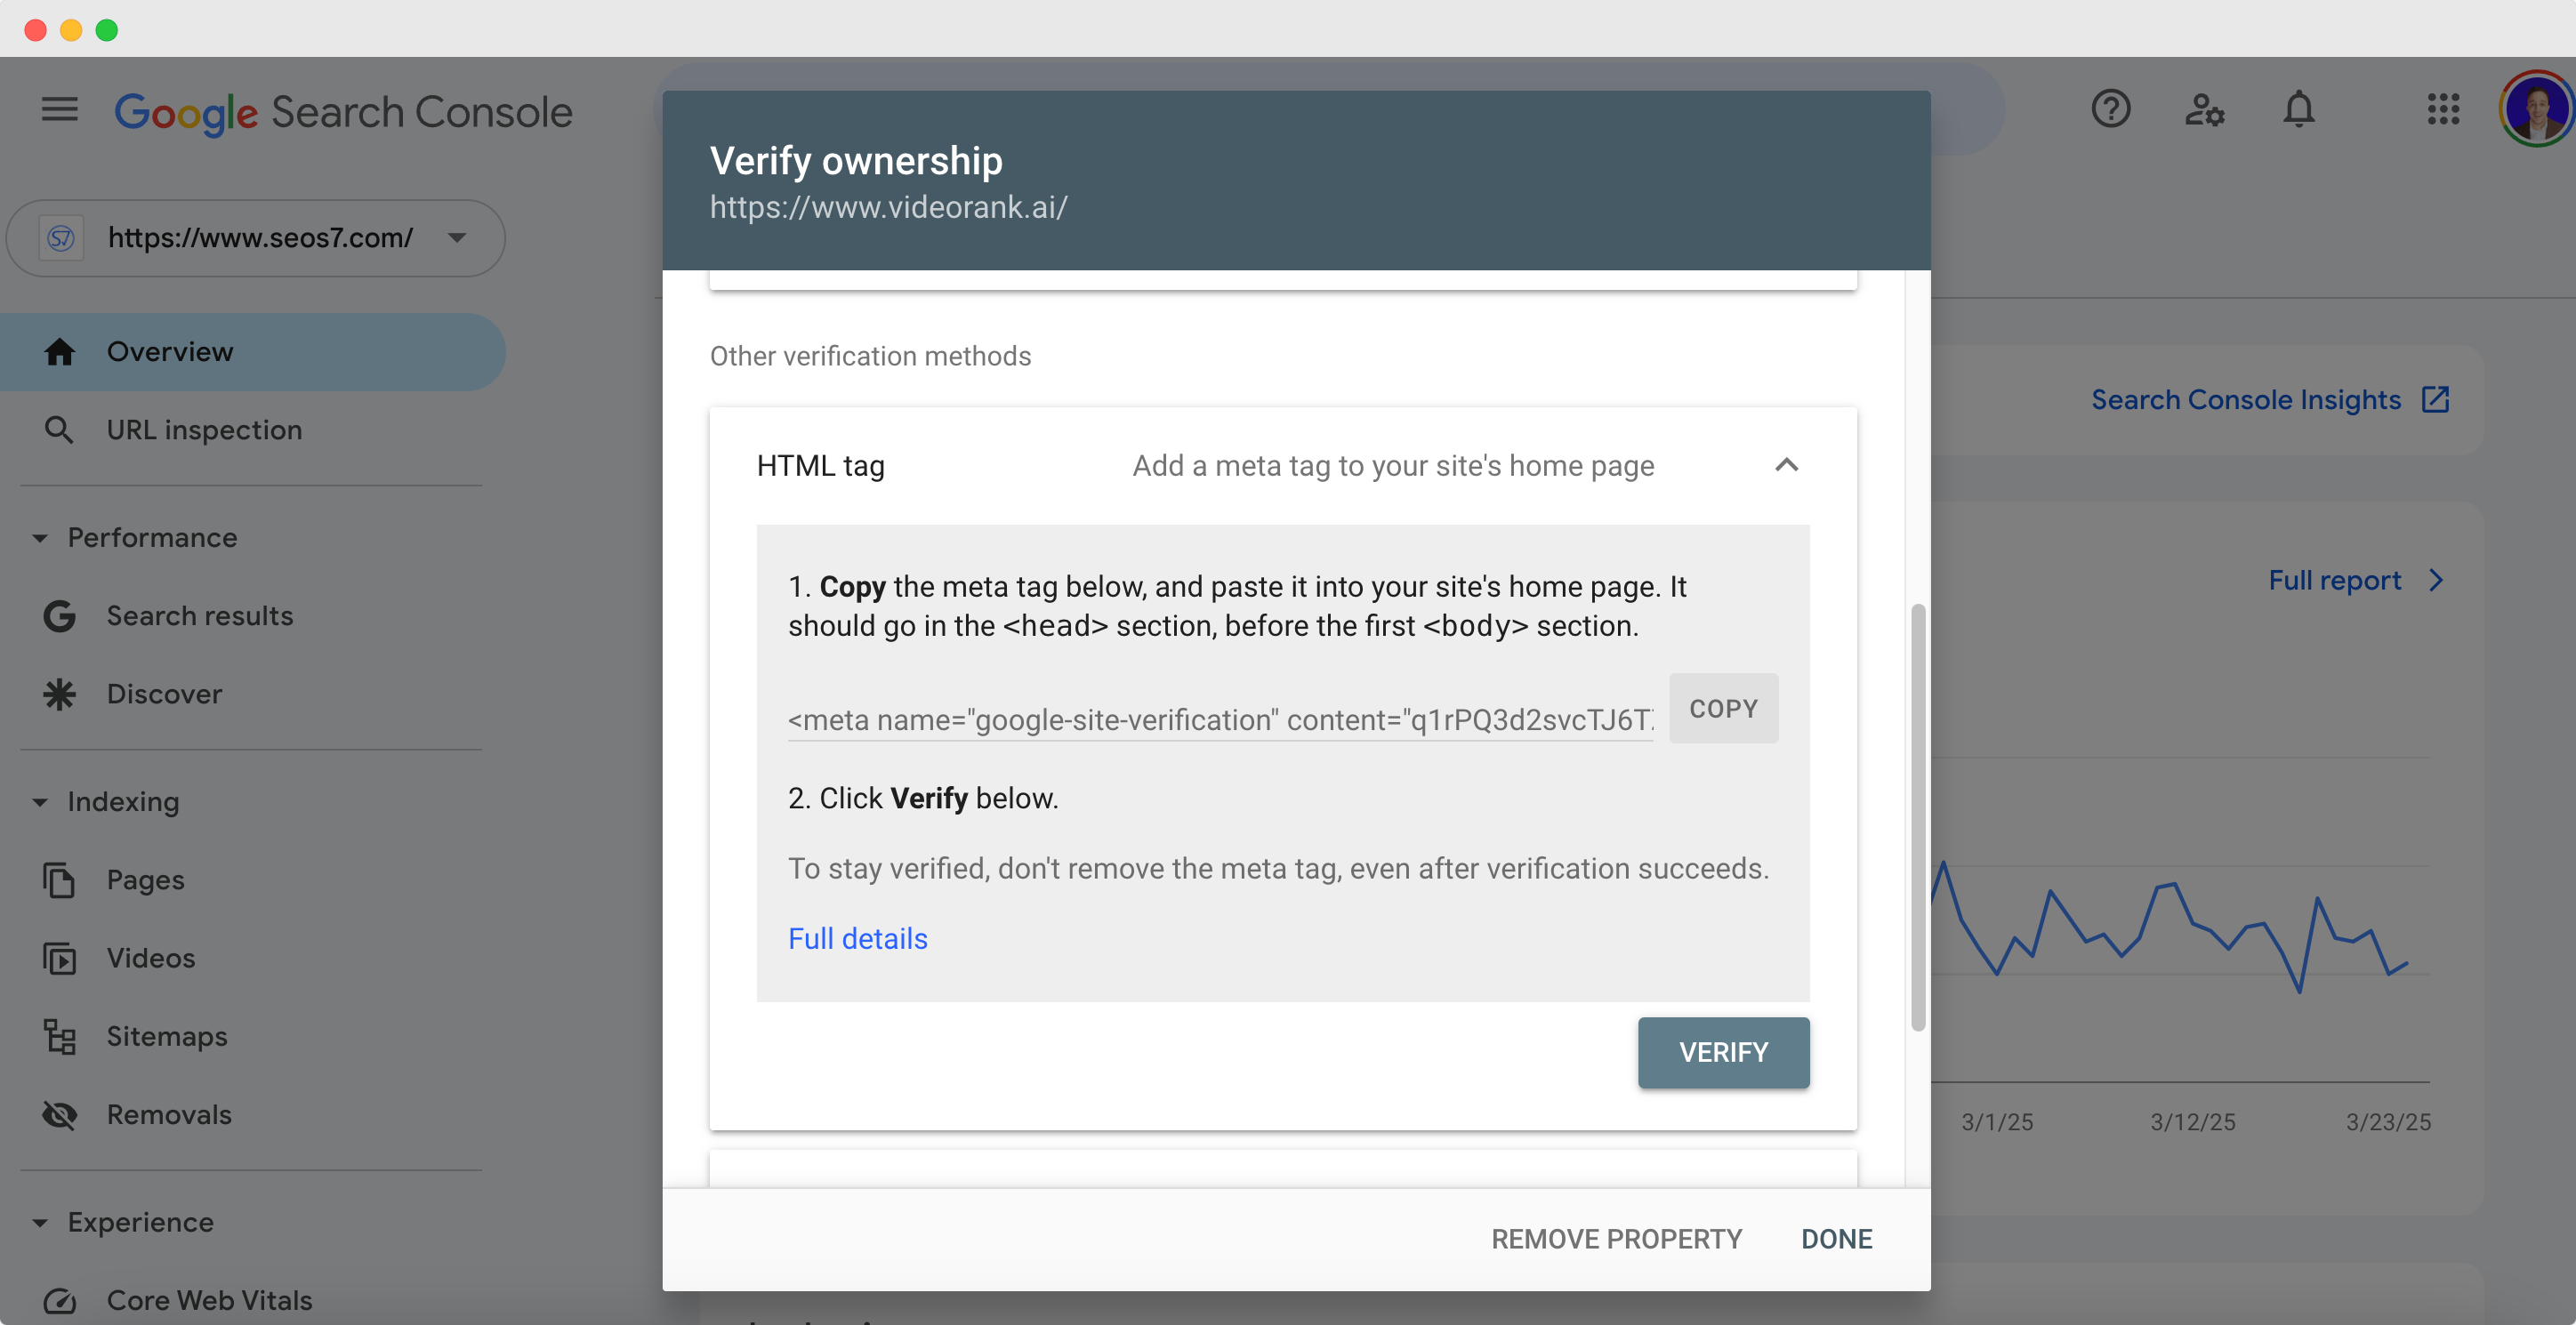
- Google Analytics or Google Tag Manager: If you already have Google Analytics tracking code on your site (and are logged into that GA account) or use Google Tag Manager, Google can verify ownership automatically through those. Just ensure you’re using the same Google account for GSC and GA/GTM, and choose the respective verification method, then hit verify.
Choose whichever method is easiest for you. For most, the HTML tag method is quick and doesn’t require file upload access.
- HTML file upload: Download the HTML verification file Google provides and upload it to the root directory of your website (e.g., via FTP or your file manager). Once uploaded (at something like
Once you’ve successfully verified, Google Search Console will start collecting data for your site. 🎉 If verification fails, double-check that you implemented the method correctly (typos in DNS records, placing meta tag in the correct spot, etc.). GSC also shows common errors to help you troubleshoot.
Pro Tip: You can add multiple verification methods (and even multiple users) for the same site. For example, after verifying via DNS, you might also add an HTML tag – this gives you flexibility if one method is removed later. Additionally, if you work in a team, you can add colleagues via Settings > Users and permissions in GSC so they can access the data too.
Step 3: Submitting Your Sitemap to Google Search Console
Now that Google knows about your site, let’s help Google find all your important pages by submitting an XML sitemap. A sitemap is basically a file that lists all the URLs on your site that you want search engines to index.
Why submit a sitemap? Google’s crawlers can discover pages on their own by following links, but a sitemap is a direct way to say “Hey Google, here are all the pages on my website.” This can speed up indexing, especially for new sites or sites with complex structures.
Follow these steps to submit your sitemap:
- Make sure you have a sitemap file. Most blogging platforms and CMSs generate one automatically. For example, WordPress sites using SEO plugins like Yoast or RankMath will typically have a sitemap at
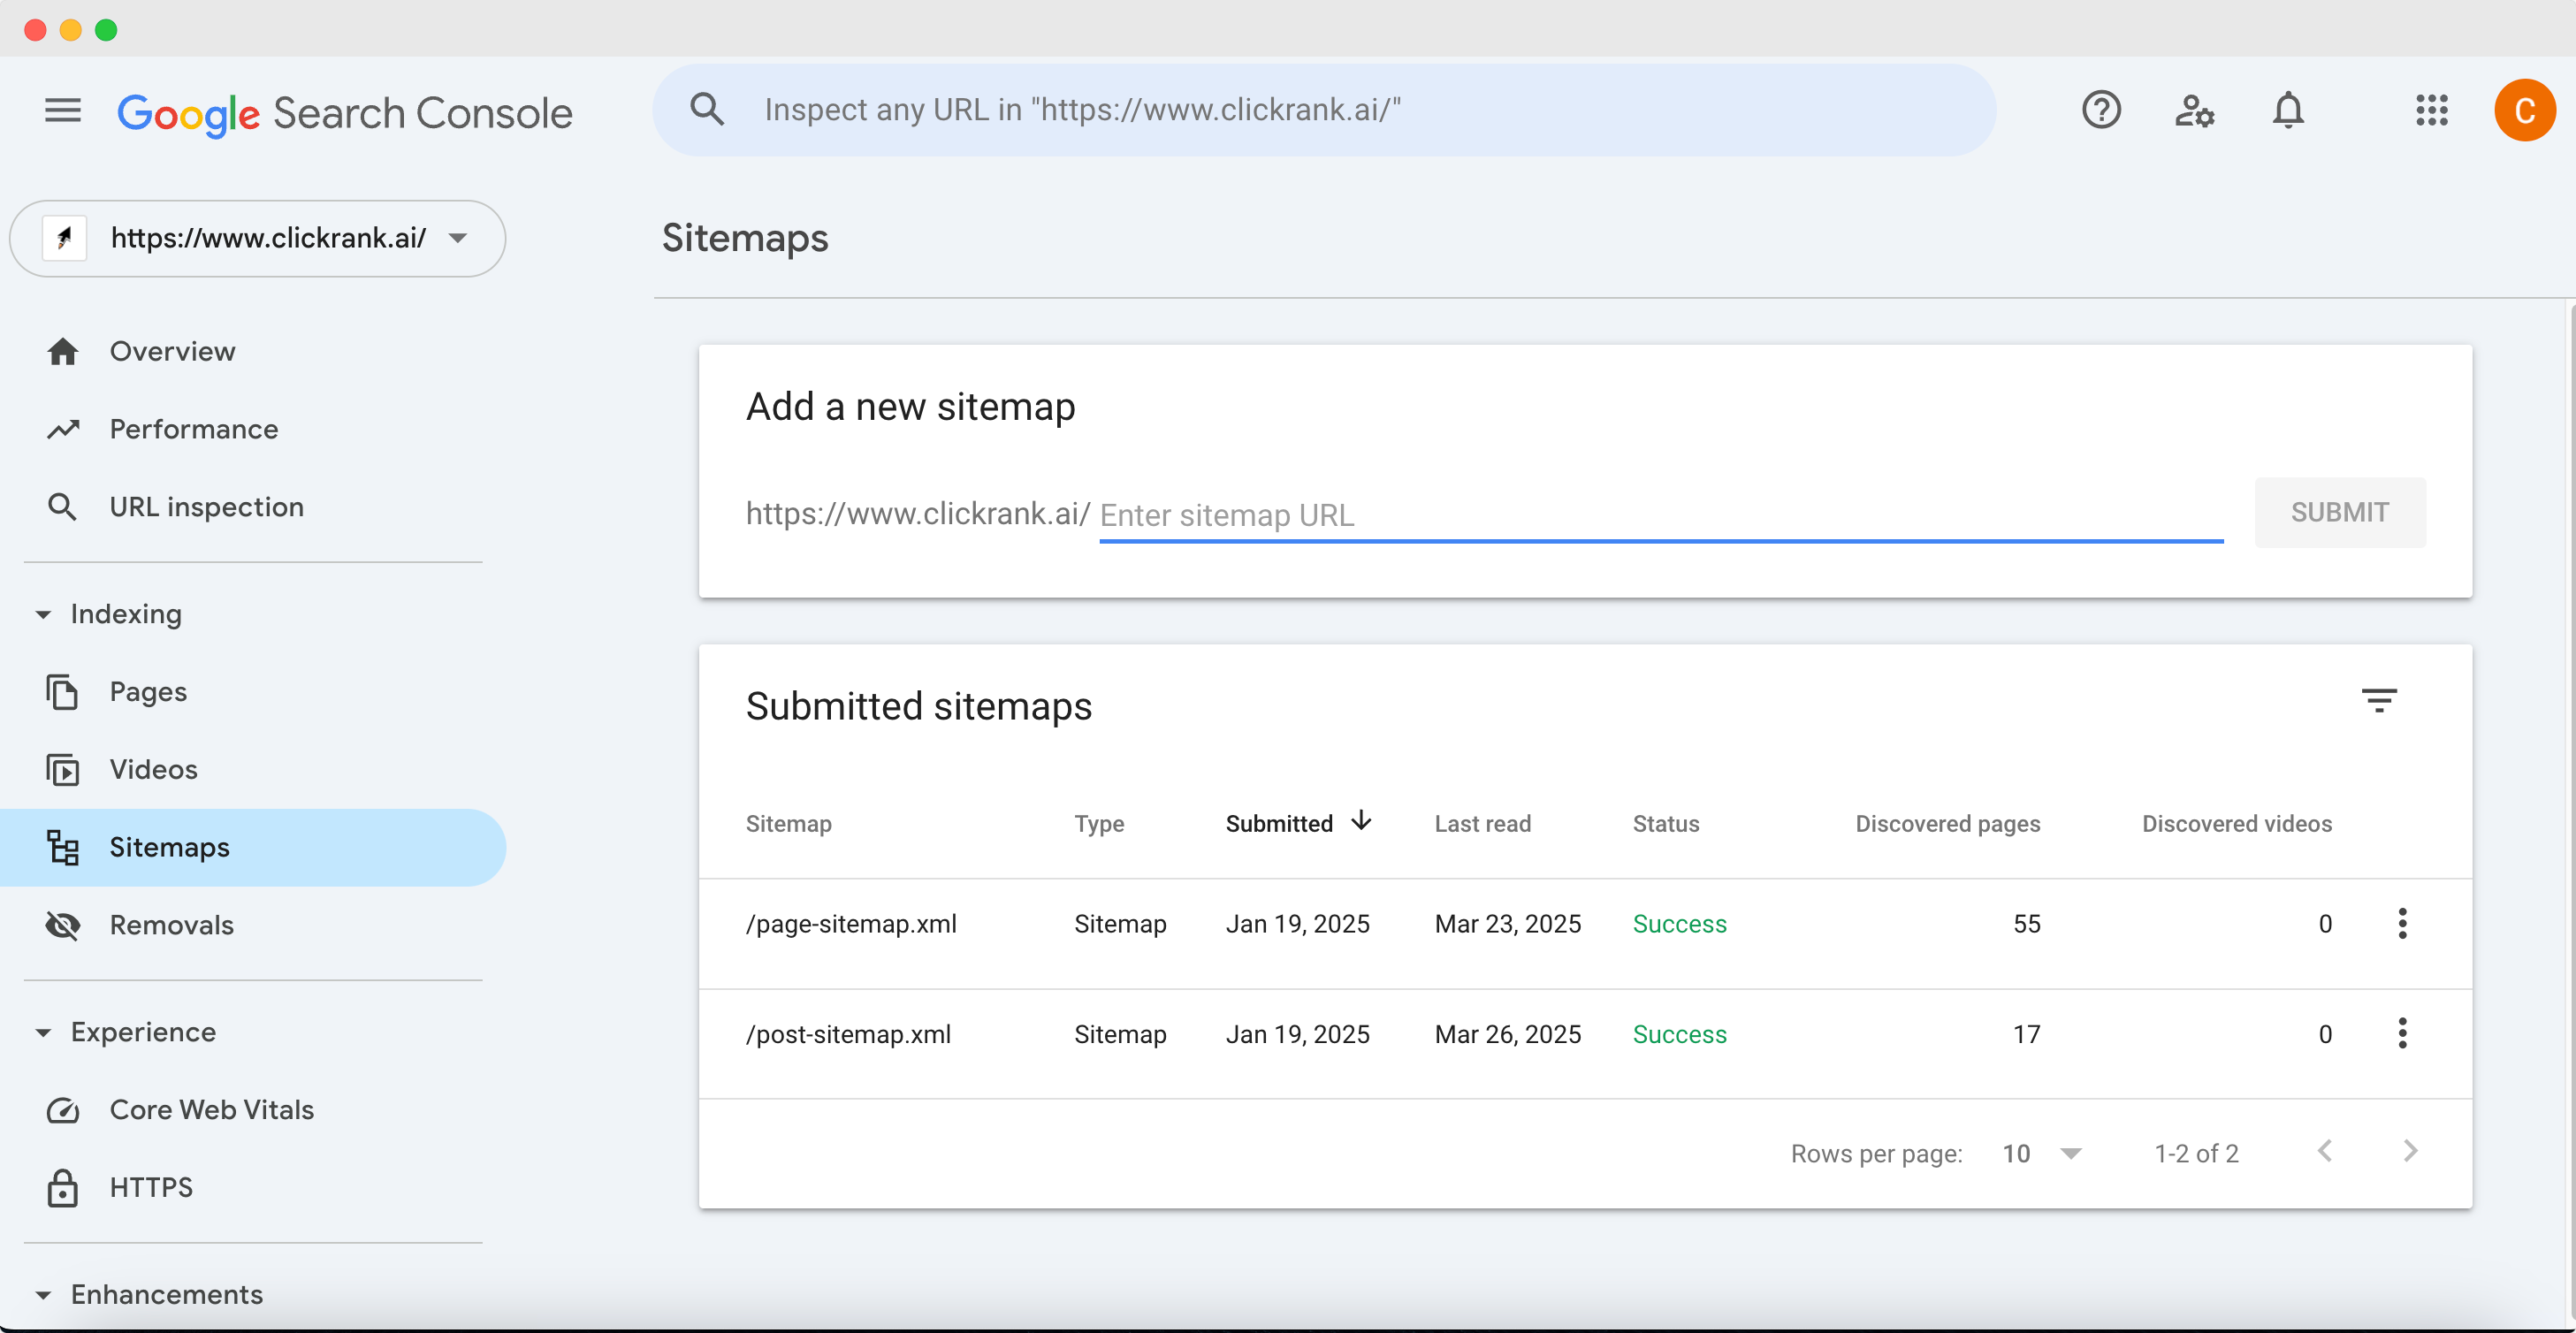
yourwebsite.com/sitemap.xml. If you’re not sure, try typing/sitemap.xmlafter your homepage URL to see if it loads. If you don’t have a sitemap, you can use online sitemap generators or plugins to create one. - In Google Search Console, navigate to the “Indexing” section in the left menu and click on “Sitemaps.” This will open the sitemap submission page.
- You’ll see a field to “Add a new sitemap.” Enter the URL of your sitemap file. You usually don’t need to type the whole URL if your property is verified – for example, it might show your domain and just ask for the path. So you would just type
sitemap.xml(or the full filename if it’s different, likesitemap_index.xml). - Click “Submit.” Google will process the sitemap and show you a status message. If it says “Success,” Google was able to fetch your sitemap. It will also show how many URLs were discovered in the sitemap.
- Check back later to see if any errors were reported. GSC will let you know if, for instance, some URLs in the sitemap were unreachable or had errors. If you see errors, fix the sitemap (or the pages) and resubmit.
Usually, a sitemap submission is a one-time thing. Google will re-crawl your sitemap periodically on its own. You can always revisit this Sitemaps page to see the last crawl date of the sitemap and the number of URLs indexed from it.
Quick tips for sitemaps:
- Keep your sitemap updated. If you’re using a CMS with a plugin, it will update automatically when you publish new posts or pages.
- You can submit multiple sitemaps if your site is large or segmented (for example, a separate sitemap for blog posts vs. products). Many sites have a sitemap index file that links to multiple sitemaps (GSC handles that seamlessly).
- Submitting a sitemap doesn’t guarantee everything gets indexed, but it greatly helps Google prioritize crawling your content.
Step 4: Monitoring Performance – Clicks, Impressions, CTR, and Position
With your site verified and a sitemap in place, Google will start collecting data on how your site is doing in search results. The Performance report in Search Console is where you’ll likely spend a lot of time – it’s an SEO goldmine! This is where you see which queries (keywords) are bringing people to your site, which pages are showing up, how often people click your results, and your average rankings.
To access this data, click on “Performance” (sometimes labeled “Performance > Search Results”) in the left-hand menu of GSC. You’ll be presented with a graph and some summary metrics. Here’s how to read and use this report:
Understanding the Key Metrics
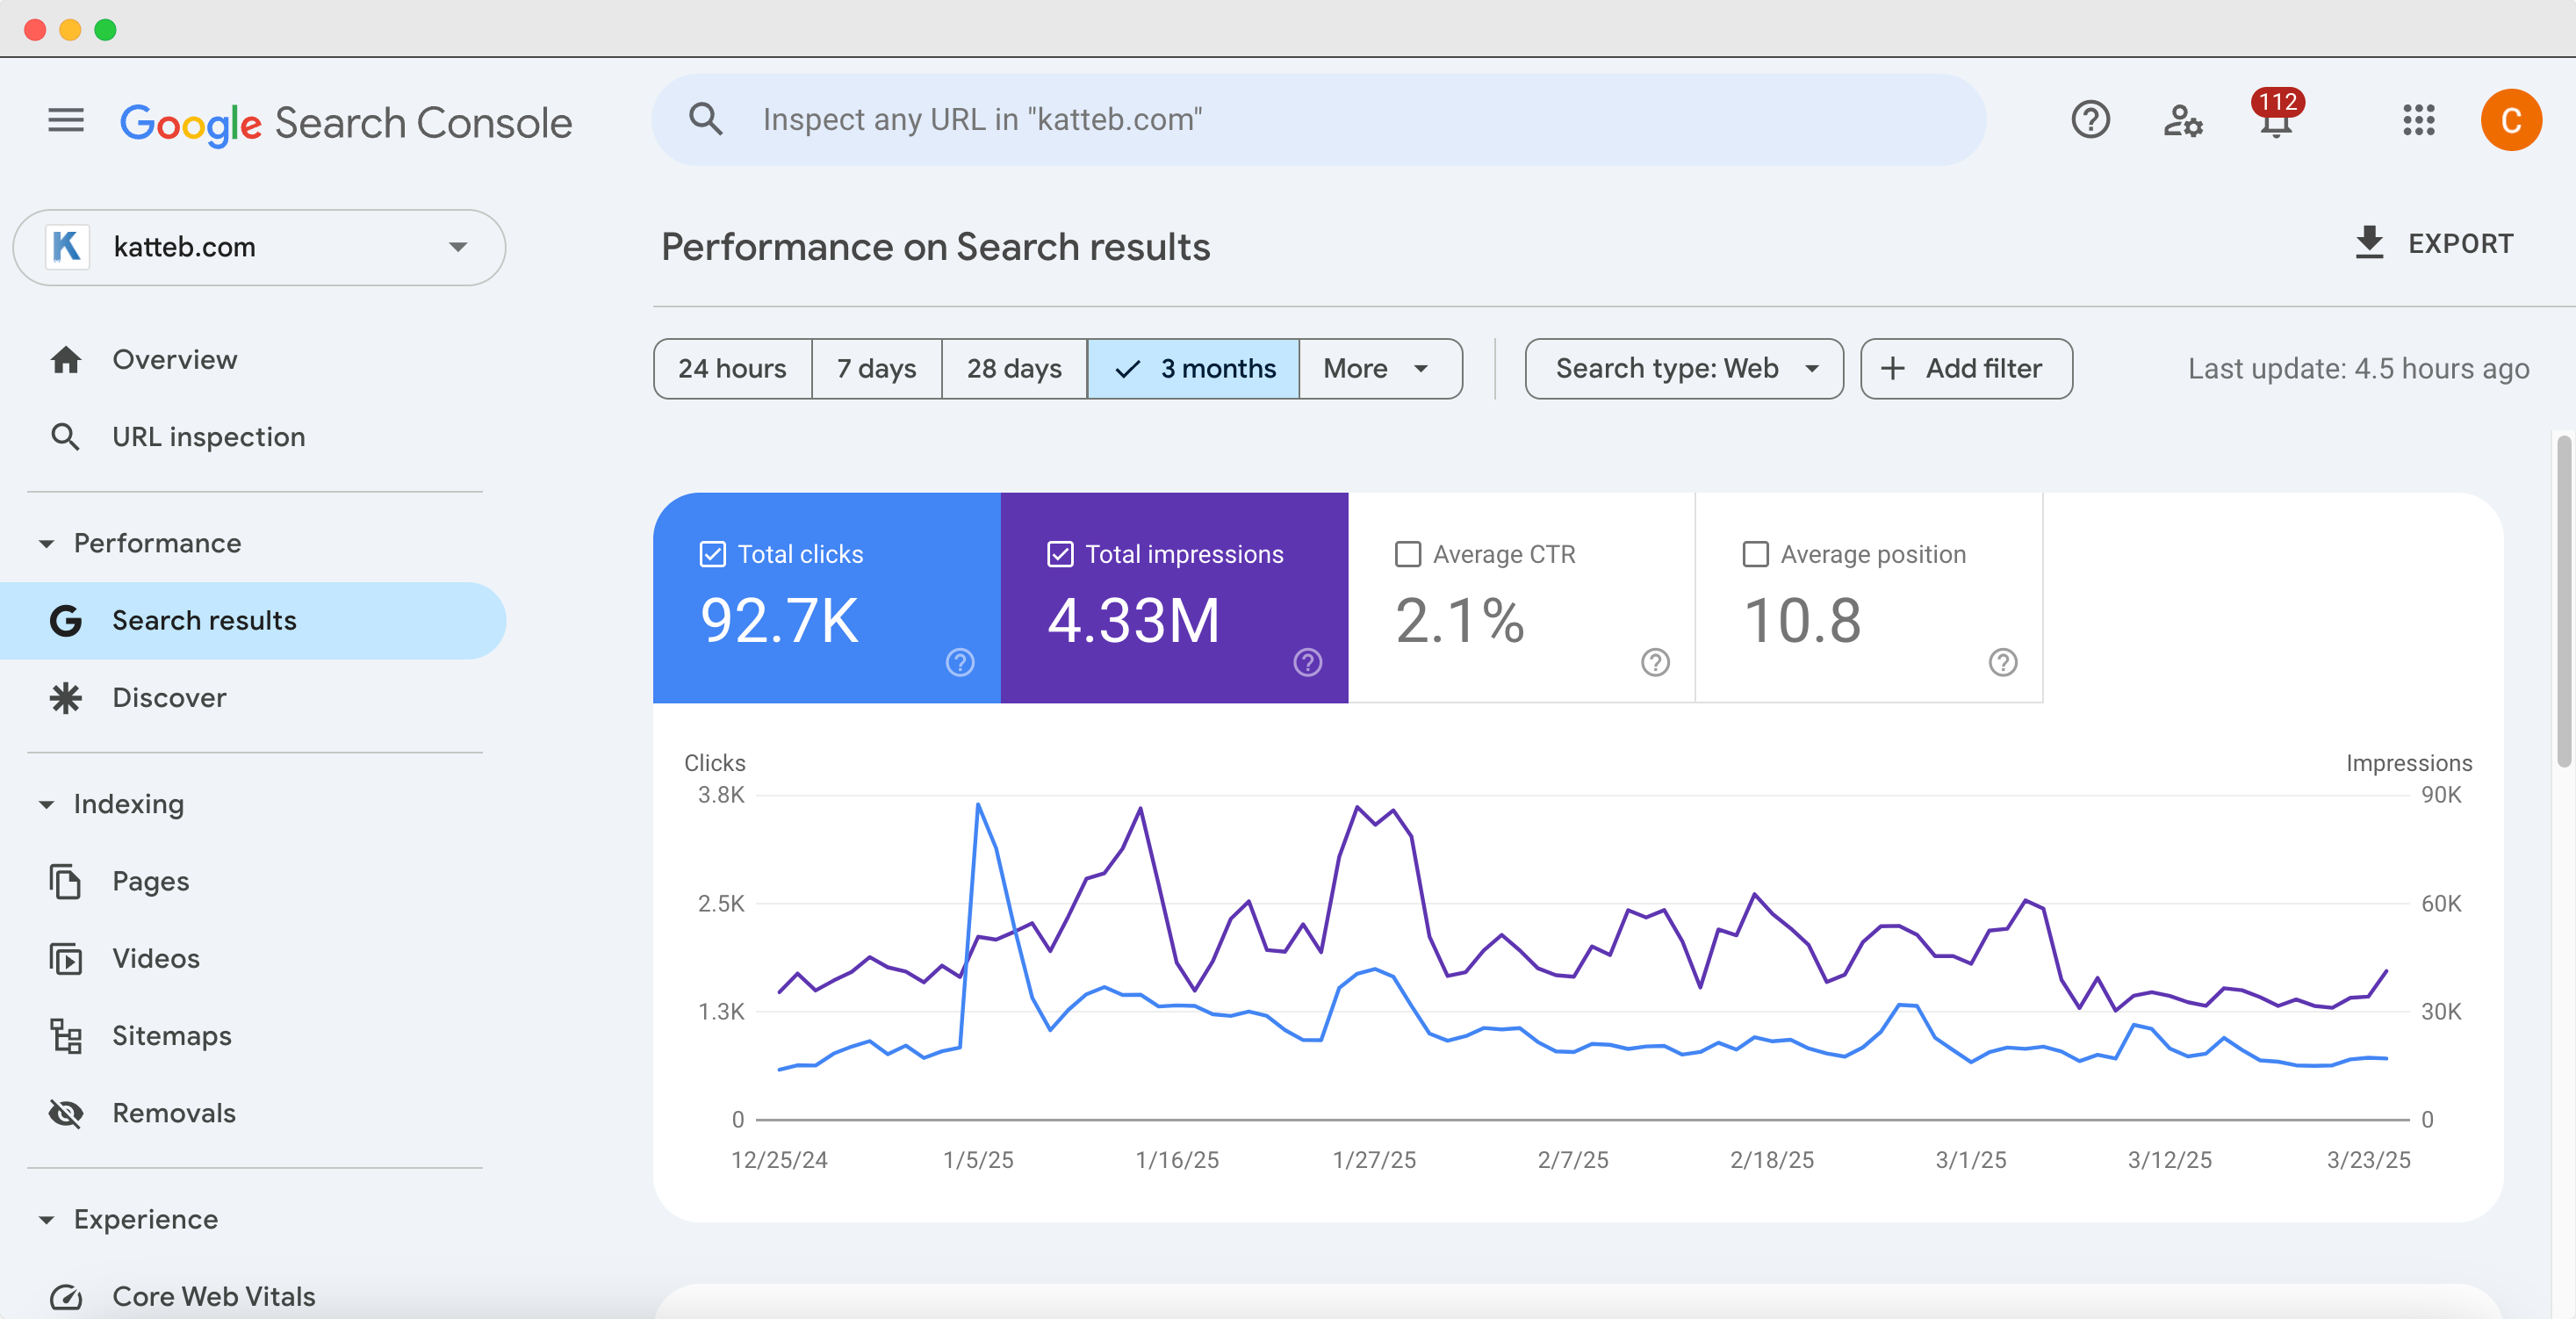
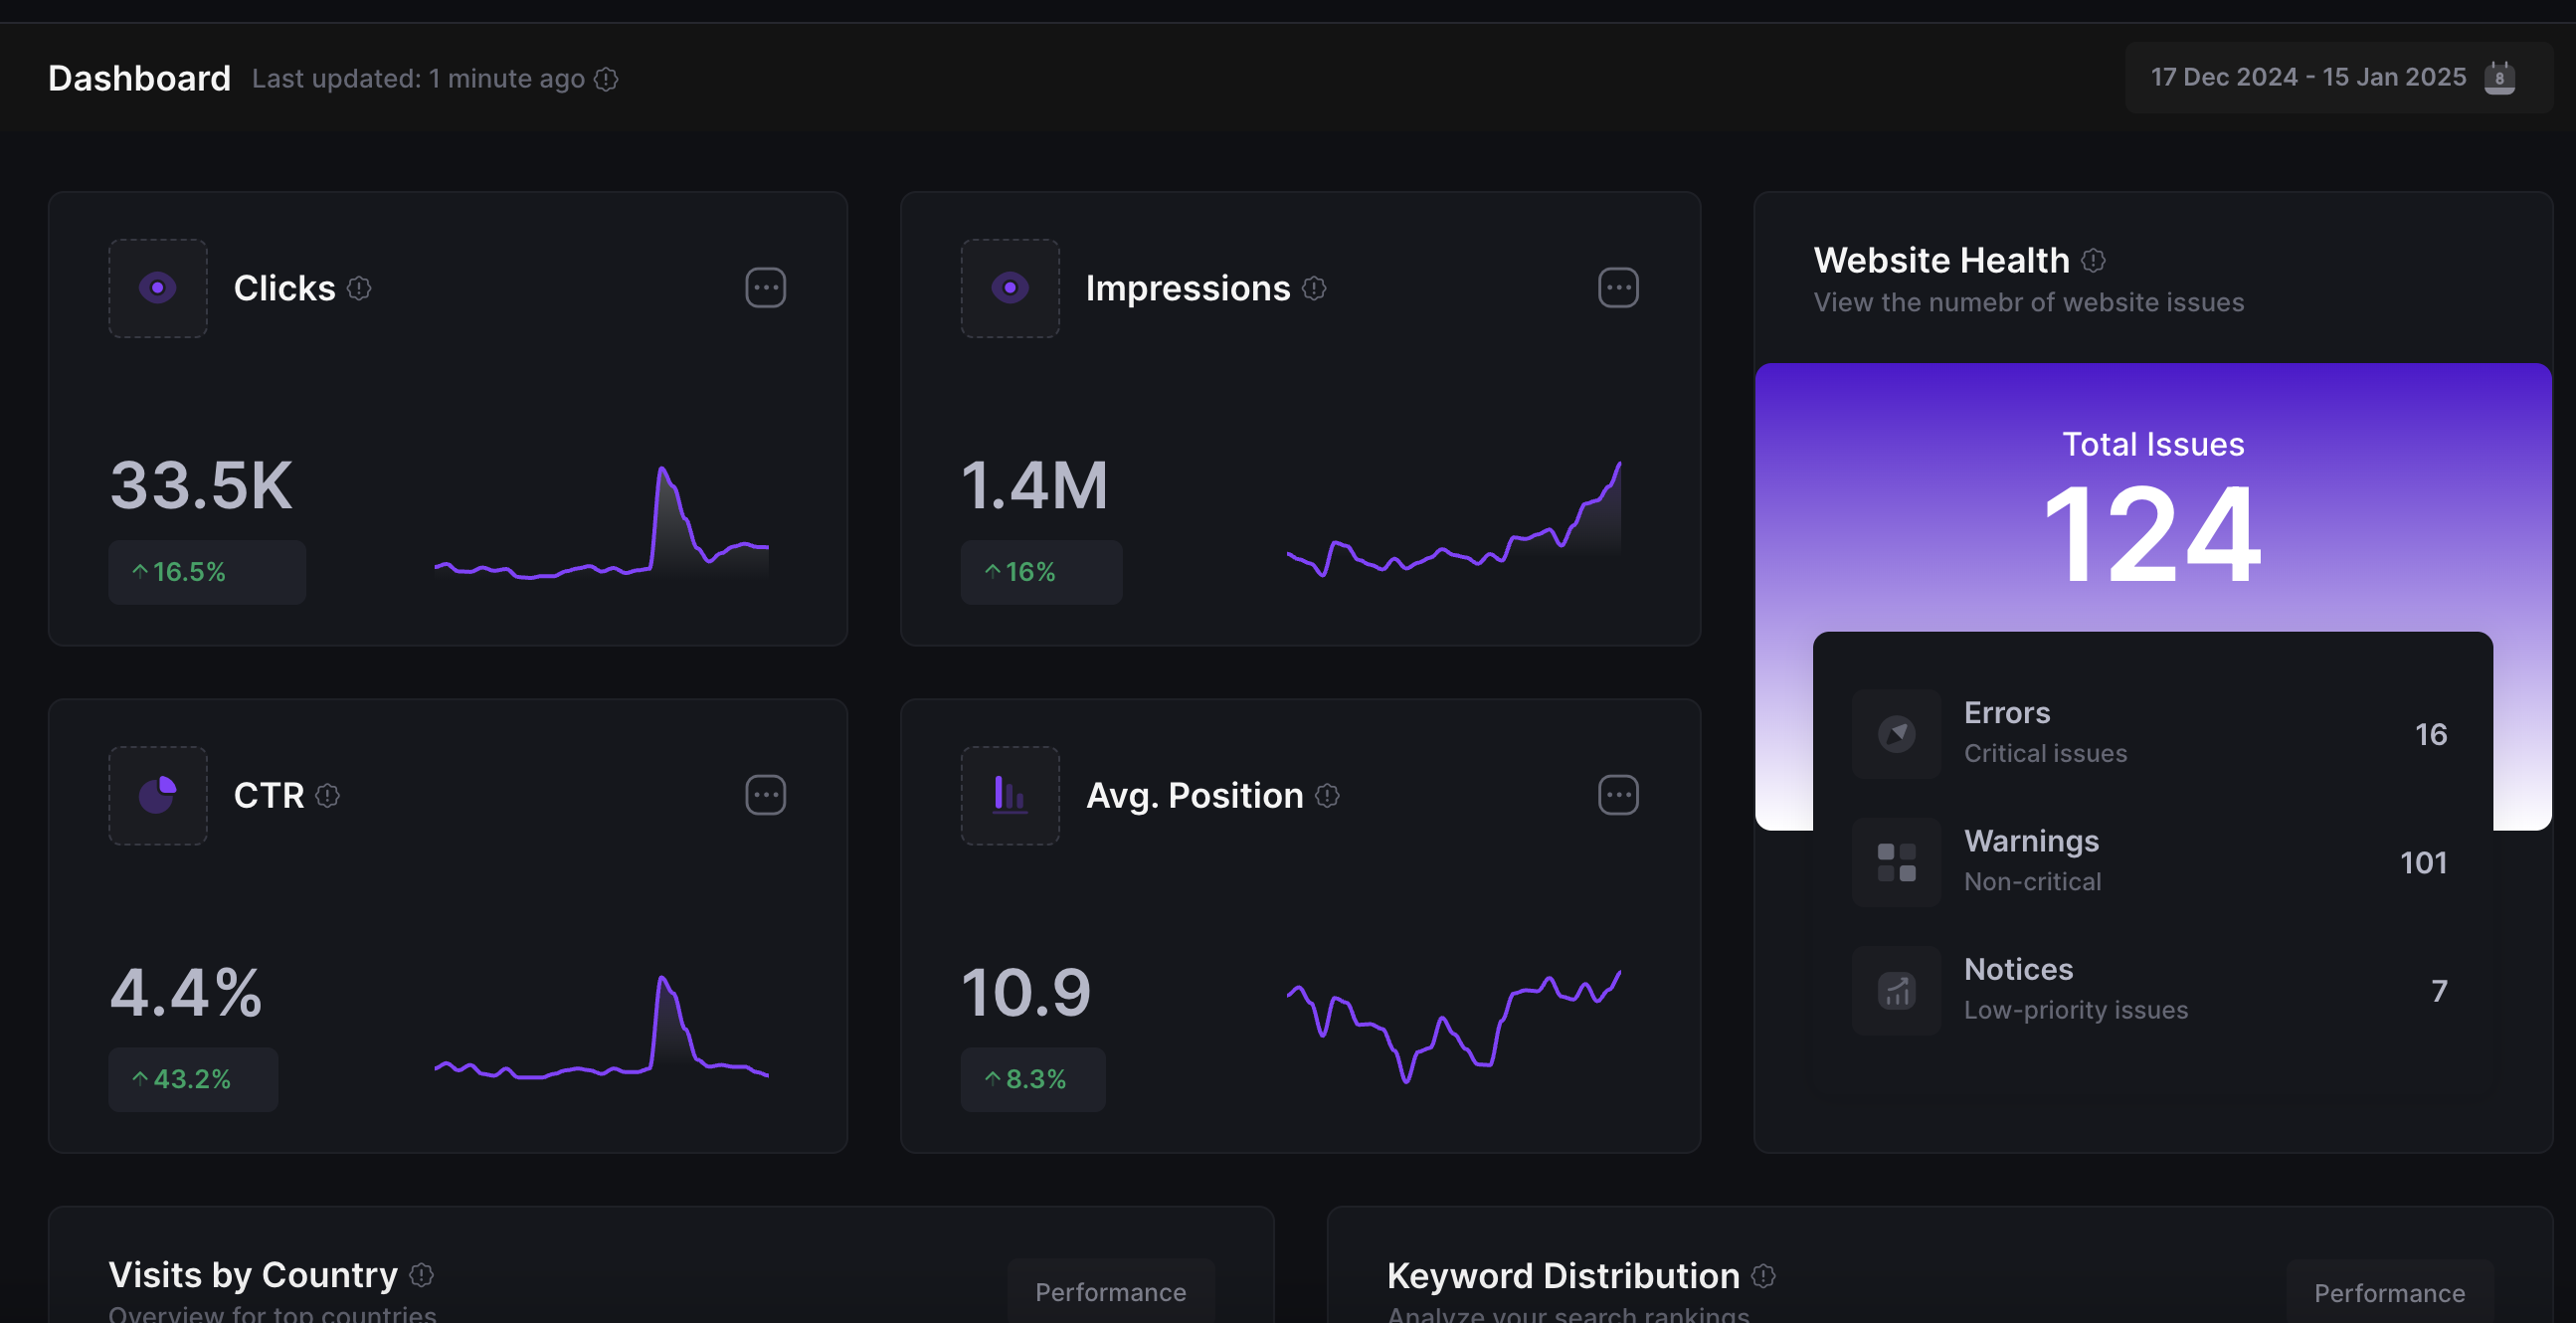
At the top of the Performance report, you’ll see four primary metrics with their totals and a trend graph:
- Total Clicks: The number of clicks from Google Search results to your site. This shows how many times searchers actually clicked through to visit your site over the selected time period.
- Total Impressions: The number of times your site appeared in Google Search results (even if the searcher didn’t scroll down far enough to see it). Essentially, any time a page from your site was loaded in the search results for someone, it counts as an impression.
- Average Click-Through Rate (CTR): The percentage of impressions that led to a click. This is calculated as Clicks / Impressions x 100. It tells you how often people who see your site in search results end up clicking on it. For example, a CTR of 5% means 5 out of 100 people who saw your snippet clicked it.
- Average Position: The average ranking position of your site for the queries it appeared in. Position #1 is the top of page 1 of Google results, position #2 is second, and so on. An average position of 3.5, for instance, means you typically rank around 3rd or 4th for the queries people searched (it’s an average across many searches).
You can toggle each of these metrics on or off on the chart by clicking them. By default, GSC shows clicks and impressions graphed over the last 3 months (the default date range), but not CTR and position until you toggle them.
Below the graph, there’s a table that’s extremely useful. It has several tabs: Queries, Pages, Countries, Devices, Search appearance, and Dates. Let’s break down how you can use these:
- Queries: This tab lists the search queries (keywords) that led people to see your site in results. You’ll see the top queries along with the number of clicks, impressions, CTR, and average position for each. This is fantastic for understanding what topics or terms your site is currently ranking for. (Example: You might see a query “chocolate cake recipe” with 500 impressions, 50 clicks, CTR 10%, position 7. This means in the selected time, your site showed up 500 times for “chocolate cake recipe” and 50 people clicked through, and on average you ranked 7th.)
- Pages: This tab lists your individual pages and their aggregate stats. It shows which pages on your site get the most impressions and clicks from Google search. It’s great for identifying your top-performing content in search.
- Countries: See which countries your search traffic comes from. If you target a global audience or specific regions, this is helpful.
- Devices: See how your traffic splits between Desktop, Mobile, and Tablet. Useful for understanding if you need to focus on mobile optimization (most sites see majority mobile impressions these days).
- Search Appearance: This shows data for special search result features, if applicable. For example, “Web” (normal results) vs “Video” or “Image” search, or if you have rich results like FAQ snippets or how-to schema, those might appear here.
- Dates: A simple breakdown by date – useful if you want to spot trends on specific days (maybe after a site change or Google update).
How to use this performance data: Start by examining your top Queries and Pages:
- Look at your top queries by clicks. are these the keywords you expected? You might find some surprising terms you’re ranking for. Look at their CTR and position too. A query with a high impression count but low clicks could mean an opportunity: people see your site but aren’t clicking, maybe your title or snippet isn’t compelling enough, or perhaps the query intent is slightly off for your content. On the other hand, a high CTR on a query indicates your snippet is attracting clicks well.
- Check the average position for your top queries. If you see some where your average position is, say, 8, 10, or even 15 (second page), those are keywords where you’re almost on the first page. These could be great targets for further optimization – a little content update or additional backlinks might bump you to page 1 and dramatically increase traffic.
- On the Pages tab, identify your best-performing pages. These are proven traffic drivers from search. Make sure to keep them updated and high quality. Likewise, see if some important content isn’t getting much search traffic – perhaps those pages need better optimization or targeting of more relevant keywords.
- Use the Countries data if relevant to ensure you’re reaching your target markets. For example, if you expected to get U.S. traffic but most impressions are from another country, you might need to tailor content or hreflang settings accordingly.
- Check Devices – if you have a lot of mobile impressions but a low mobile CTR or high position (meaning you rank worse on mobile), it could hint at mobile usability issues or slow mobile speed affecting your mobile ranking. GSC’s Experience reports (including Core Web Vitals, discussed later) will help with that.
Remember, you can adjust the date range in the Performance report (top filter bar) to see data for the last 7 days, 1 month, 3 months, up to 16 months, or set a custom range. You can also compare two date ranges (useful to see if your clicks improved after an SEO change).
For bloggers and marketers, this performance data is incredibly valuable for content strategy. It basically tells you what Google thinks your site is about (via the queries you show up for) and how users respond. Use it to double down on content that’s working and to improve or reposition content that isn’t.
(Speaking of metrics, if you want to dive deeper into understanding SEO metrics in general, check out our guide on SEO Performance Metrics: What to Track and How to Measure SEO Success for a broader look at measuring SEO results.)
Step 5: Identifying and Fixing Indexing Issues (Coverage Report)
Having great content isn’t useful for SEO if Google can’t index it! The Indexing (Coverage) report in GSC helps you ensure that your pages are getting indexed properly by Google, and alerts you to any problems that might be preventing indexing.
In the left menu, under “Indexing”, select “Pages” (previously known as Coverage report). Here you’ll see a summary of indexed pages and non-indexed pages on your site:
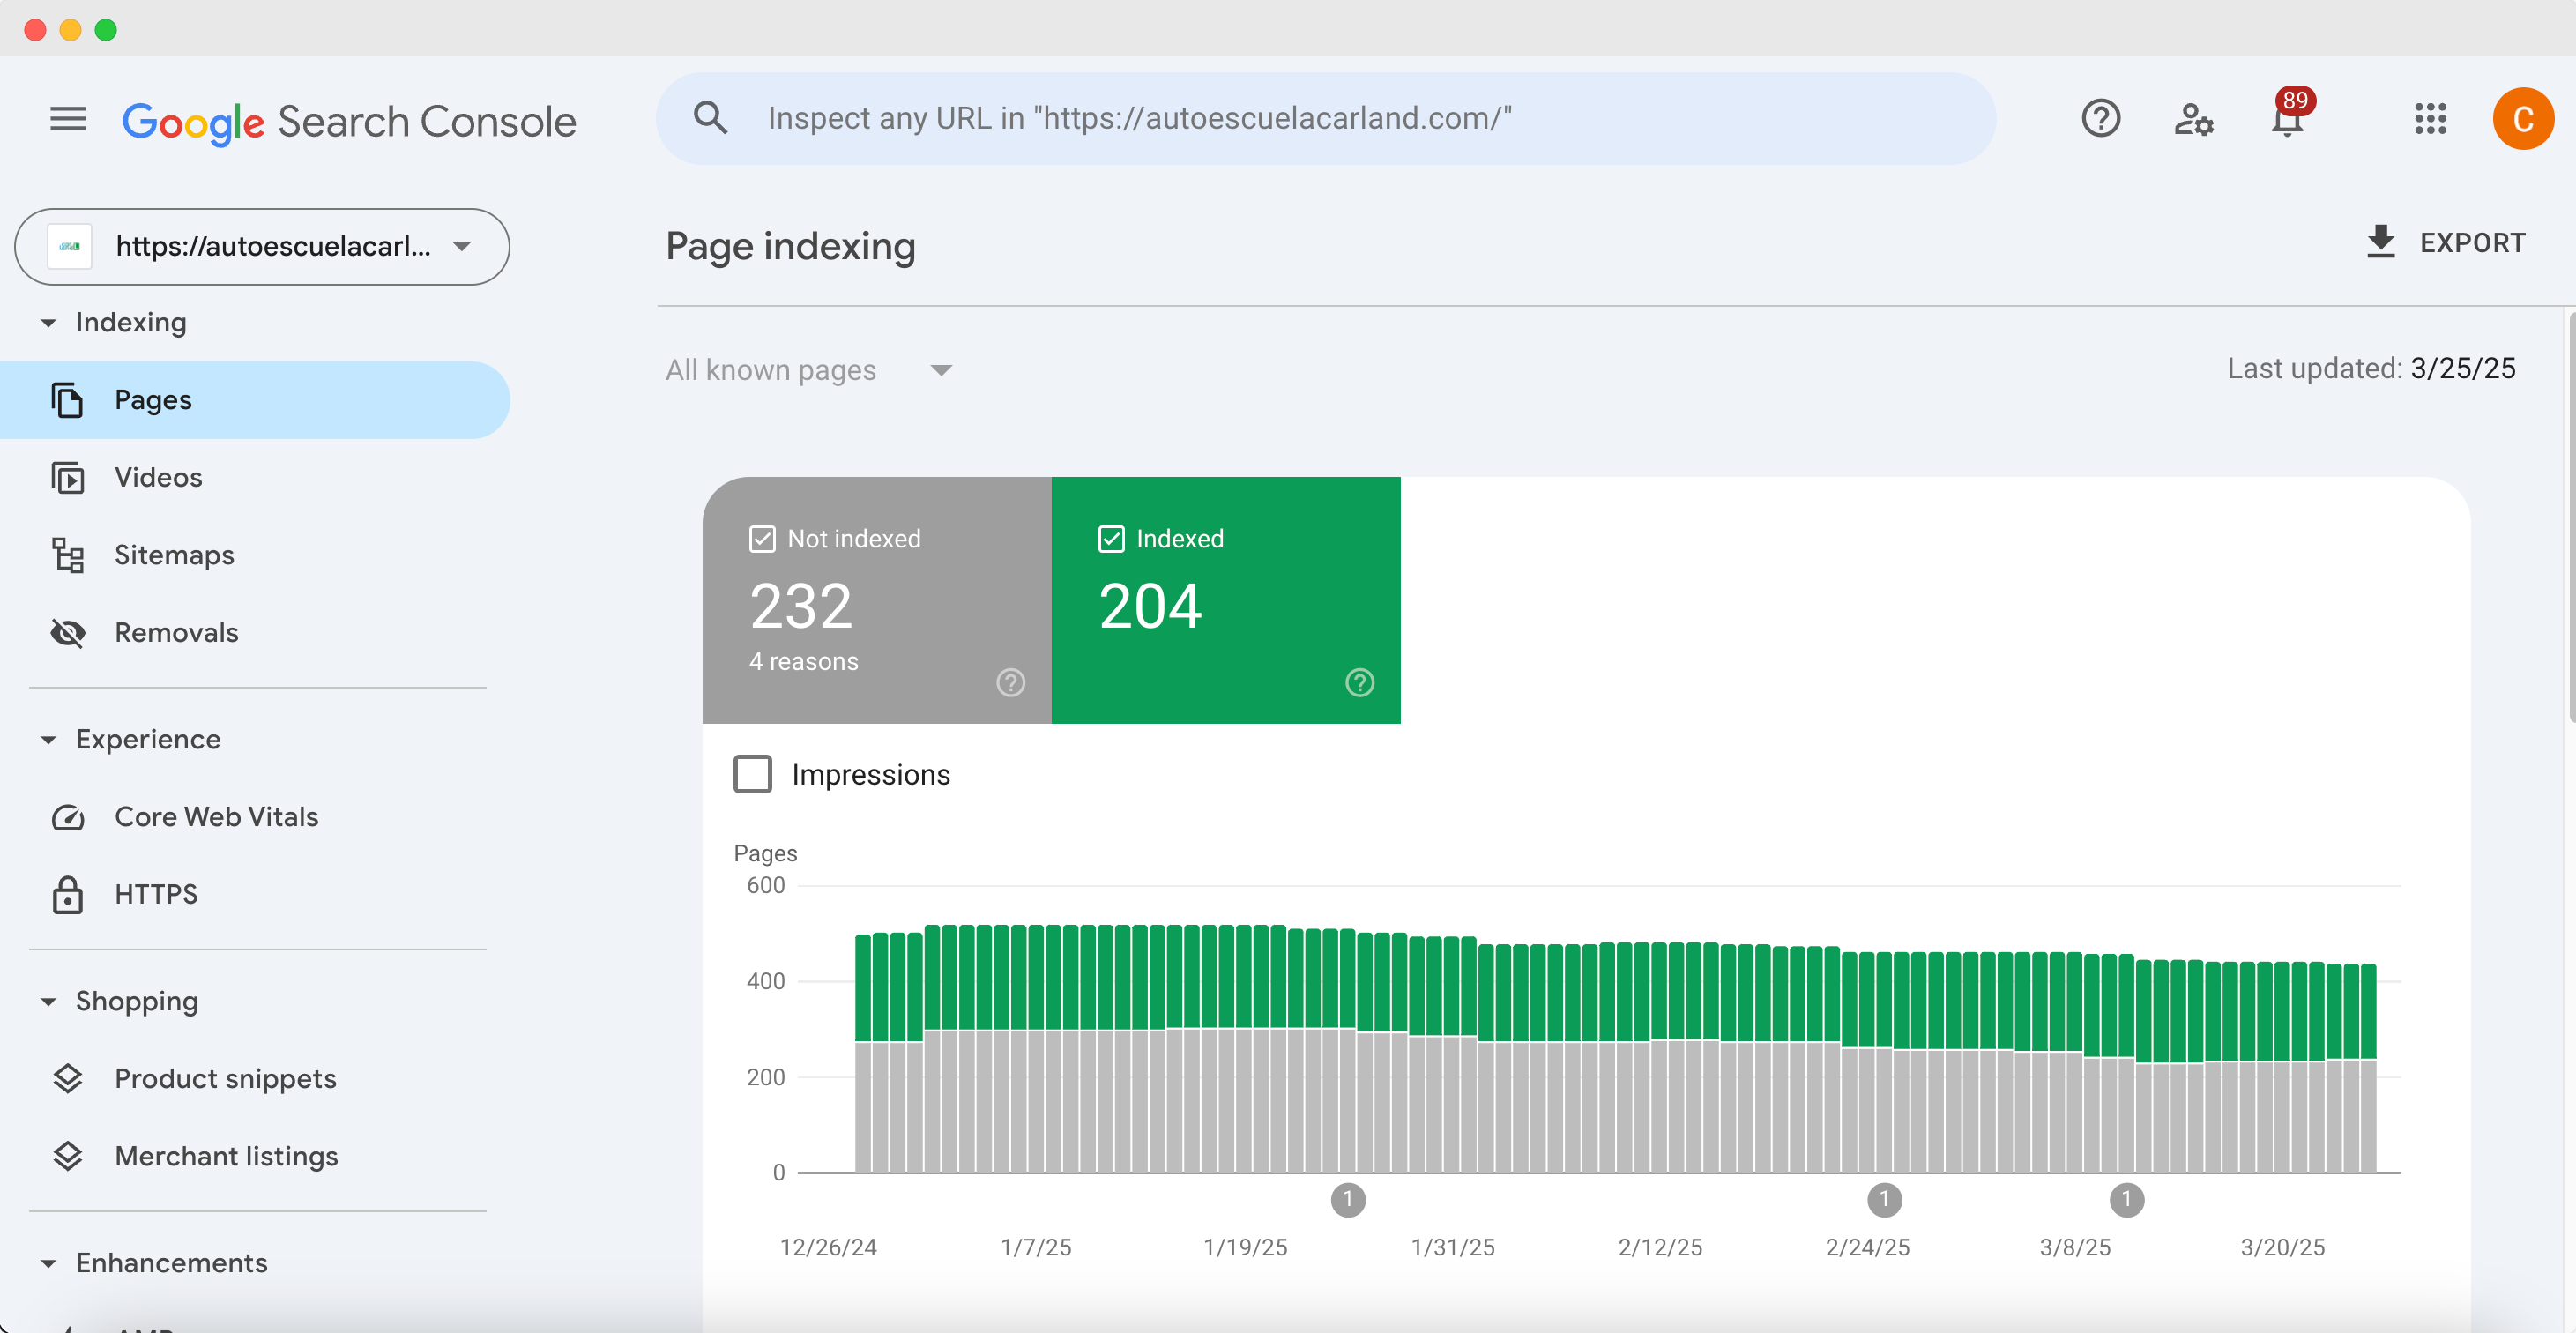
- Indexed (Valid) pages – URLs from your site that Google has indexed and can serve in search results.
- Not Indexed – URLs that Google knows about but did not index for some reason (you’ll see reasons for these).
On the summary page, Google will often highlight “Error” and “Warning” categories if any exist:
- Error usually means a page that should be indexed couldn’t be (for example, a server error or a page with a redirect loop).
- Excluded (or Valid with warnings) covers pages that were intentionally not indexed or skipped (like duplicates, or ones you blocked with
noindexor robots.txt).
Scroll down and you’ll find a detailed list of issues with counts of affected pages. Some common statuses you might see:
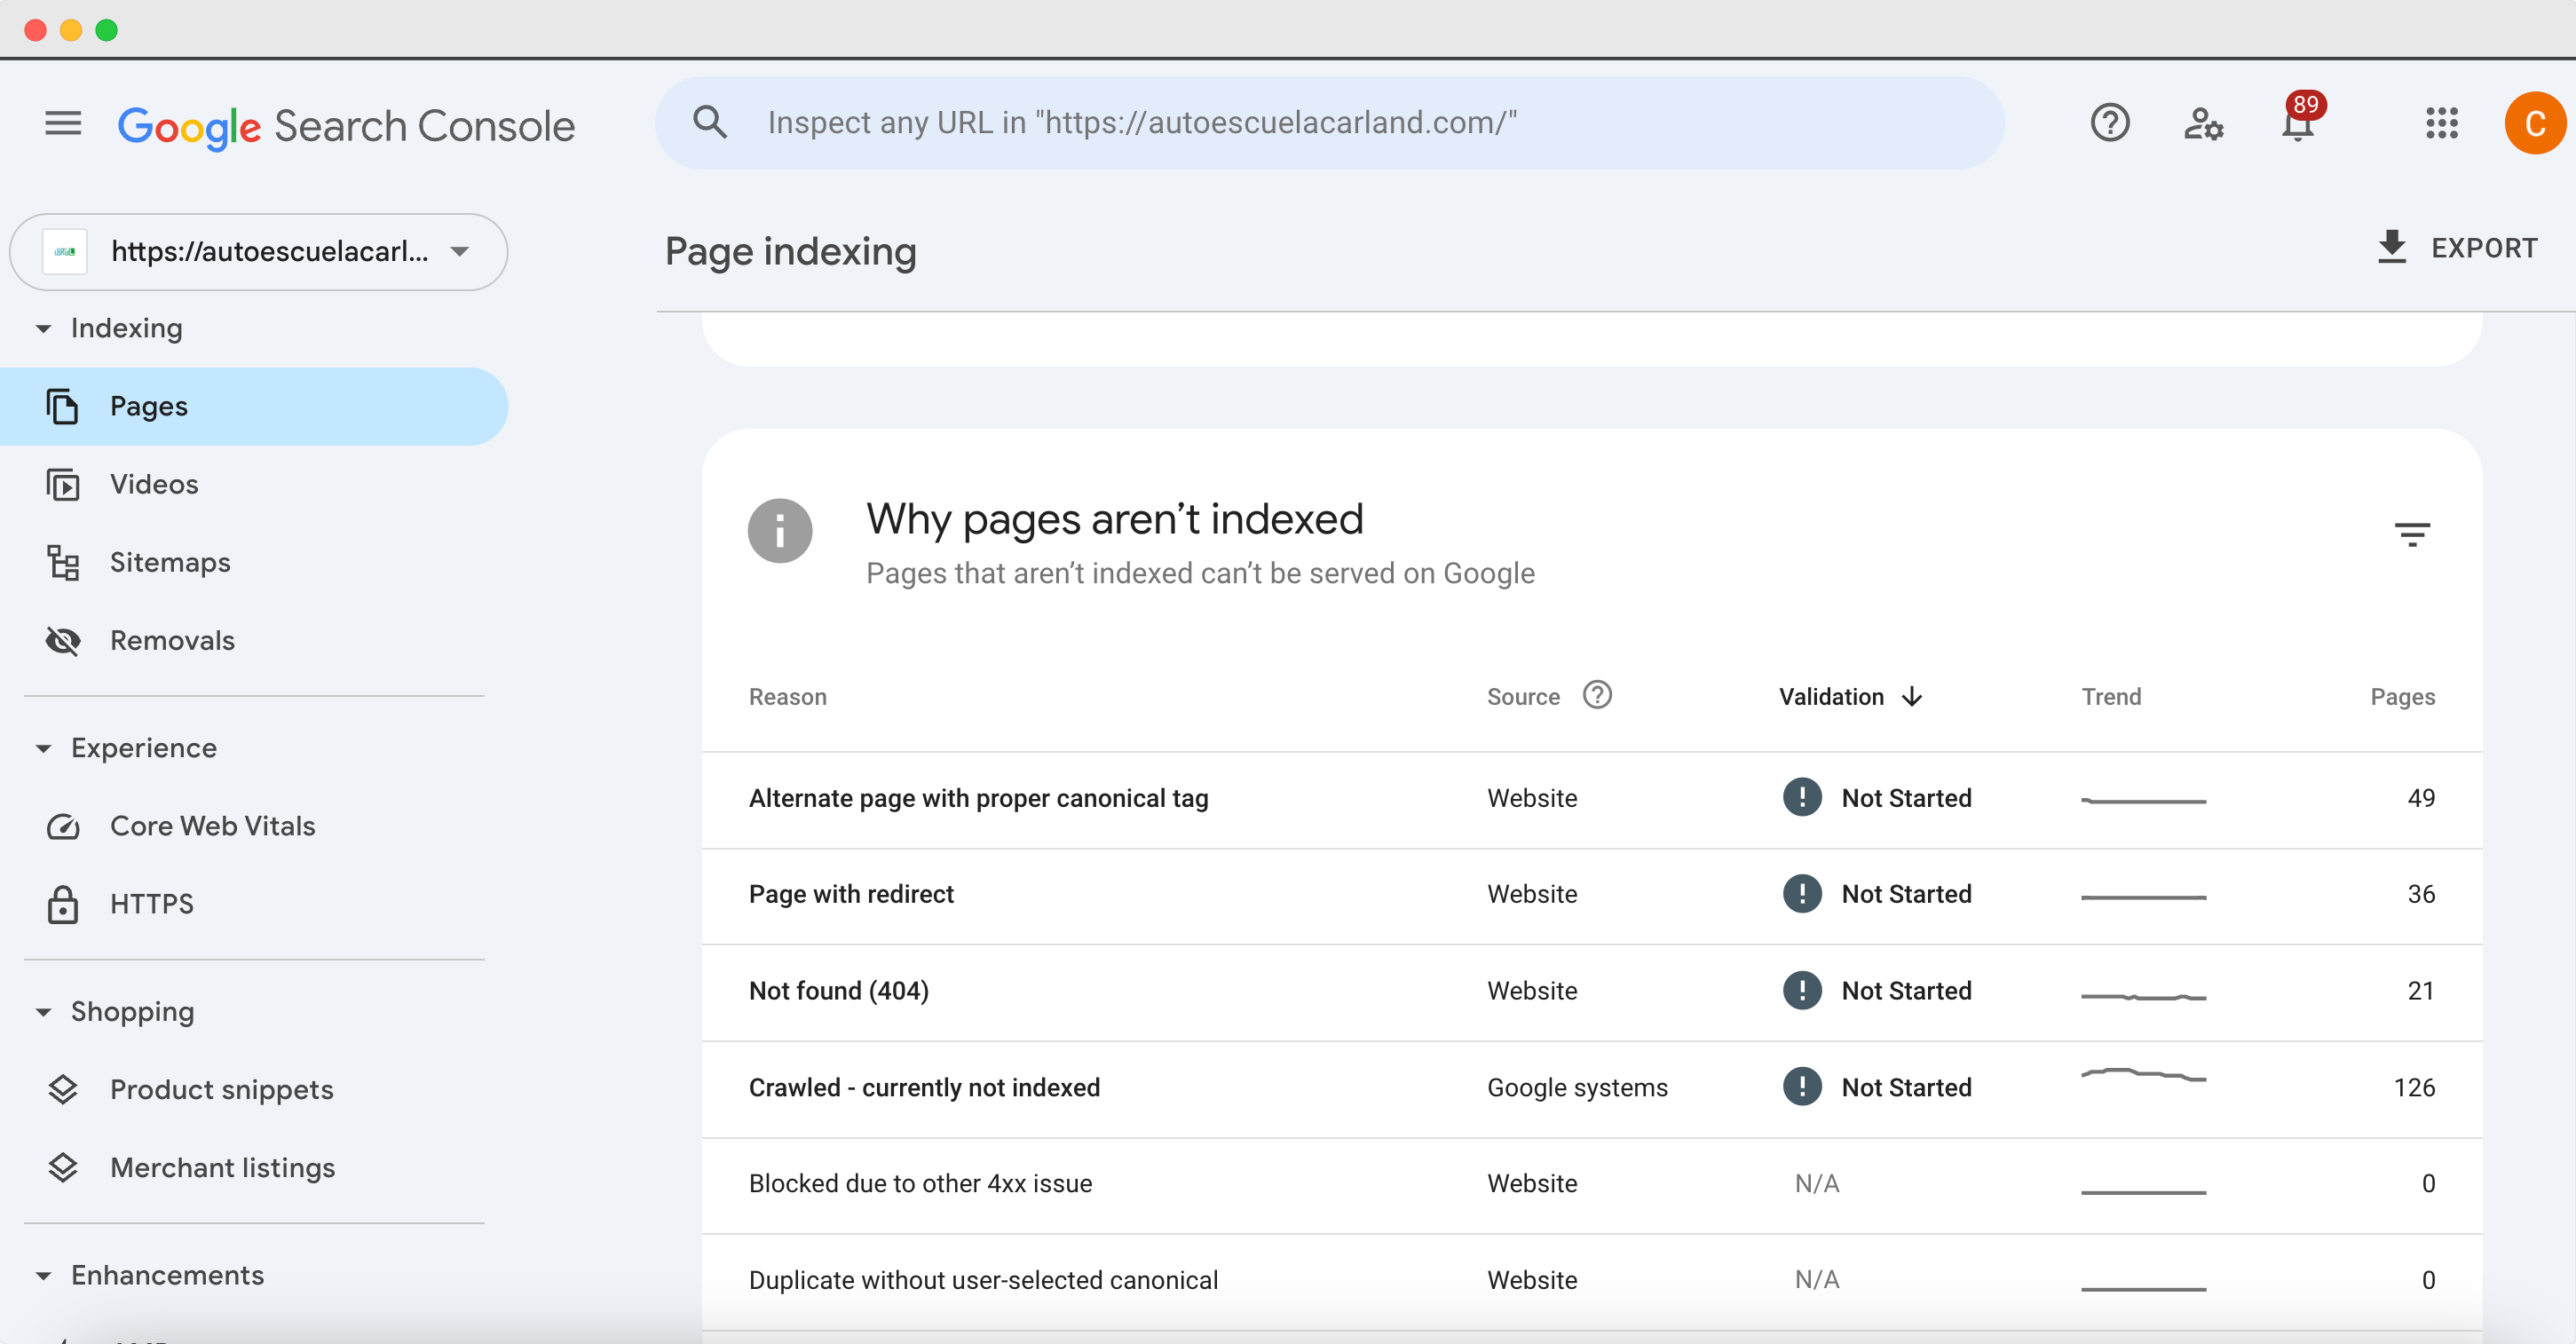
- Submitted URL not found (404): You listed a URL (maybe via sitemap) that doesn’t exist (404 error). These should be fixed by either removing those URLs from the sitemap if they’re old, or setting up proper redirects for moved content.
- Submitted URL has crawl issue / crawl anomaly: Google had trouble crawling the page (could be a transient issue or something like a timeout). Investigate if the page loads slowly or sometimes gives errors.
- Duplicate, Google chose different canonical: This means Google thinks this page is a duplicate of another and is indexing that other page instead. Ensure you set your canonical tags correctly if you want a specific one indexed.
- Excluded by ‘noindex’ tag: The page has a
noindexdirective, so Google is obeying that and not indexing it. If you intended to noindex it (like a private page or a duplicate), all good. If not, remove the noindex tag. - Blocked by robots.txt: Your site’s robots.txt file disallowed Google from crawling the page. If that page should be indexed, update robots.txt to allow it.
- Soft 404: The page didn’t explicitly return a 404 code, but Google thinks it’s basically an empty or error page (perhaps a page with no content or an error message without a proper 404 code). Treat these like real 404s – fix the content or redirect if needed.
- Server error (5xx): Google encountered a server error when trying to crawl. If your site was down or had issues, this can happen. Ensure site stability and then you can request a recrawl.
For each issue type, click on it to see the list of affected URLs. If the issue is something you can fix (and for important pages, you should), do so on your site (for example, fix the broken link causing the 404, or remove an unintended noindex). After fixing, go back to GSC, click on the issue, and hit the “Validate Fix” button. Google will then re-crawl those pages and update the status if the issue is resolved.
Keep an eye on this Indexing/Pages report regularly. It’s normal for some pages to be not indexed (for instance, tag pages, admin pages, or duplicate content might be intentionally excluded). But you want to make sure that any page you care about is indexed and there are no widespread errors.
For bloggers, a typical scenario is publishing a new post and waiting for Google to index it. If it’s not indexed after a while, check this report or use URL Inspection (next step) to see why. For marketing teams, if you launch new landing pages or site sections, verify here that they’re getting indexed properly.
Note: Google doesn’t index everything, even if you submit it. If it deems some pages low-value or very similar to others, it might not index them. Focus on providing unique, valuable content on each page. If you find important content not indexed, you may need to improve its quality or internal linking.
(For a deeper dive into indexing speed and how Google’s indexing works, see our article Why Google Takes 24+ Hours to Index Your Site (When Others Don’t). It explains what affects indexing times and how you can encourage Google to index your content faster.)
Step 6: Using the URL Inspection Tool
Have a specific page you want to check on? The URL Inspection tool is your go-to. This tool lets you inspect a single URL on your site to see its current index status and any issues, and it allows you to request (re)indexing of that URL.
You’ll find the URL Inspection bar at the top of the Search Console interface (or an option in the menu). It’s a simple text field that says “Inspect any URL” – enter the full URL of a page on your site that you want to inspect (you can copy-paste from your browser, including the https://... part).
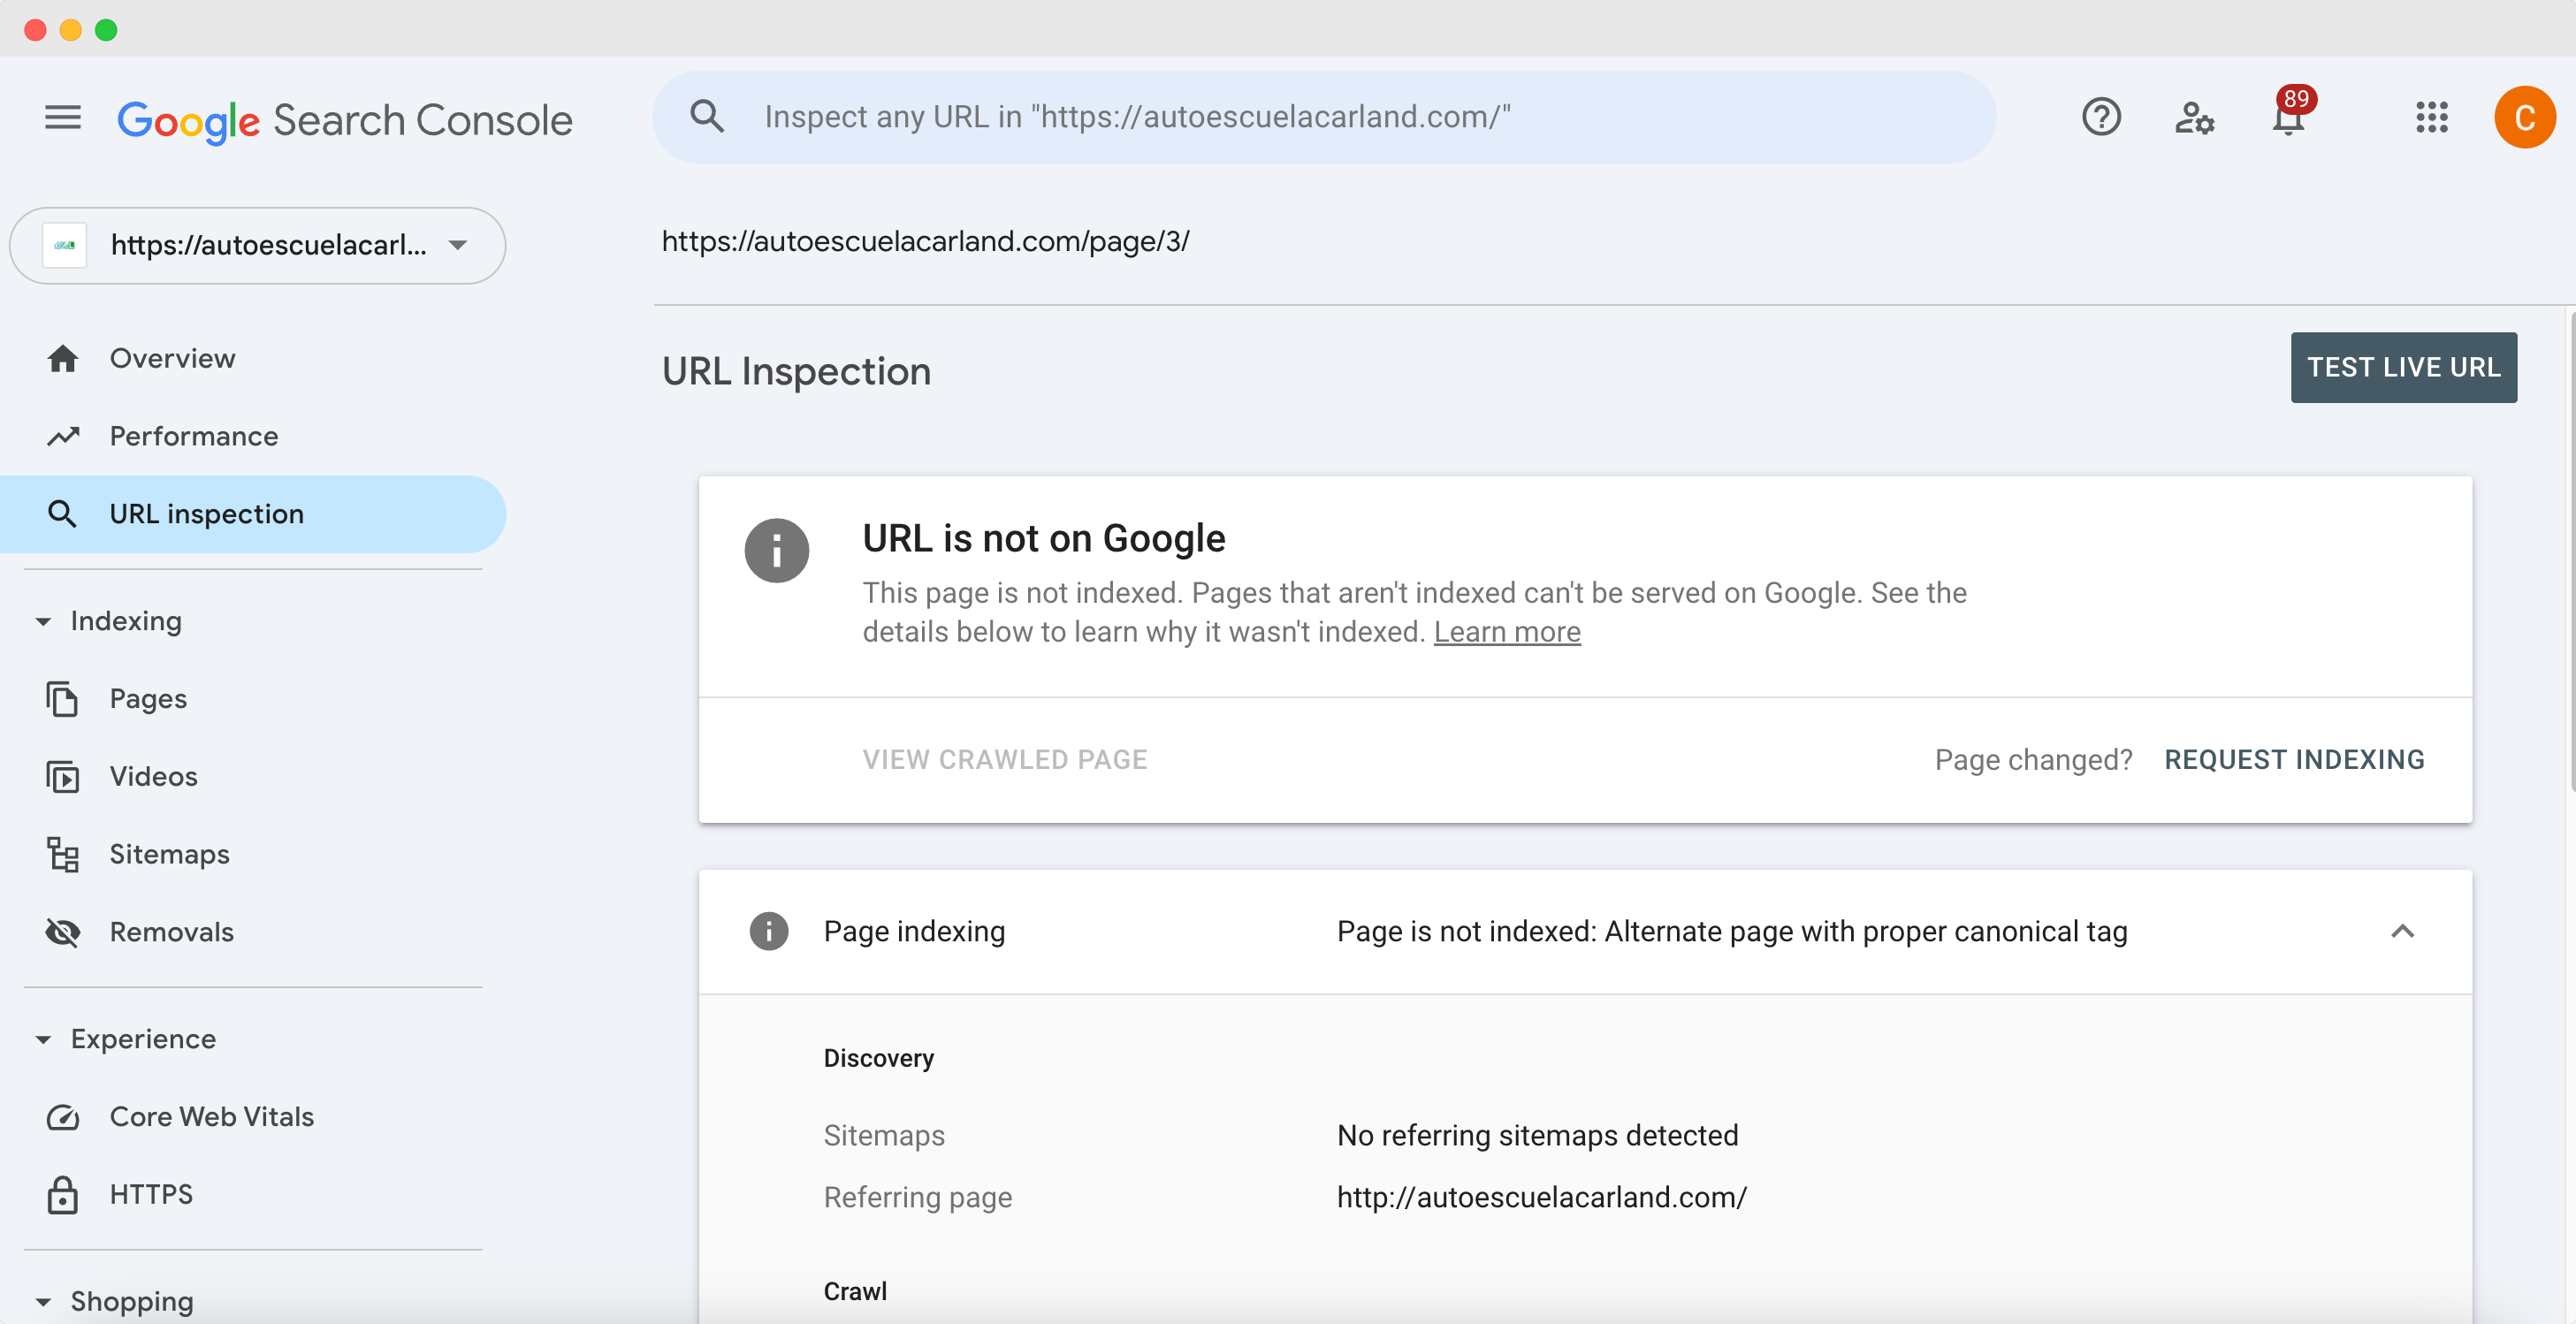
What the URL Inspection tool tells you:
- Index Status: After a moment, GSC will report whether the URL is indexed or not. If indexed, it will say “URL is on Google” and provide details like the canonical URL Google selected (in case it thinks a different URL is canonical), and whether it was submitted via sitemap.
- Coverage Details: It will reiterate any coverage status (like “Indexed, not submitted in sitemap” or “Excluded by noindex” etc., similar to the coverage report but specific to this page).
- Last crawl date: You’ll see when Googlebot last crawled the page and what the result was (crawl successful or any errors).
- Page fetch & render: For indexed pages, you might see a link to “View crawled page” which can show the HTML Google saw, and sometimes a screenshot of how Google rendered the page. This is useful to catch if Google couldn’t fully load your page’s resources (for example, if important content is loaded via JS that Googlebot couldn’t see).
- Mobile Usability: It will note if the page is mobile-friendly or if there are mobile usability issues.
- Core Web Vitals (if available for that URL): It might show if the URL has good/poor vitals (though CWV is usually looked at in aggregate reports).
- Enhancements: If the page has any structured data (like FAQ, Recipe, etc.), it will list whether that is valid or has errors.
The most popular feature here is the Request Indexing button. If the URL is not indexed (and you want it to be), or if you recently updated the page significantly and want Google to re-crawl it sooner, you can click “Request Indexing.” Google will then queue this URL for crawling. Usually, Google will crawl it within a few minutes to a few hours and, if all is good, index the new content. This is extremely handy for new blog posts – after publishing, run the URL inspection and request indexing to get them in Google’s index faster. (There’s no guarantee of how fast, but often it’s pretty quick.)
A few tips for URL Inspection:
- Use it for troubleshooting specific pages. If a page isn’t ranking or isn’t indexed, inspect it. The tool might reveal a simple issue (like a noindex tag was left on the page by mistake, which you can then fix).
- Use “Test Live URL” (there’s an option to test the live version) which will have Google do a fresh live crawl and see if things are okay at that moment. This can bypass cached results if you fixed something and want to check immediately.
- Don’t abuse Request Indexing. It’s there for important or new pages. If you have a massive number of pages to submit, use sitemaps. But it’s perfectly fine to request indexing for new posts or key pages here and there.
- If the tool shows everything is fine but the URL isn’t indexed, it might be that Google just hasn’t decided to index it yet. Ensure the page has some internal links pointing to it and give it a bit of time. Focus on content quality if a page repeatedly isn’t indexed.
For bloggers and marketers, the URL Inspection tool is like a health check for individual pages. It gives peace of mind that your new content is recognized by Google, or provides diagnostic info if something’s wrong.
Step 7: Checking Core Web Vitals and Page Experience
Google cares about user experience, and they have specific metrics to quantify it – known as Core Web Vitals. In Search Console, under the “Experience” (or directly “Core Web Vitals”) section, you can see how your site performs in terms of loading speed, interactivity, and visual stability. These factors can impact your SEO because Google uses them (among many signals) to assess page quality.
To view Core Web Vitals in GSC:
- Click on “Core Web Vitals” in the left menu (it might be under an “Experience” heading along with things like Mobile Usability if applicable).
- You will see separate reports for Mobile and Desktop. Each will show a summary: how many URLs are rated “Good”, “Needs improvement”, or “Poor” for their Core Web Vitals.
- Click on “Open report” for either mobile or desktop to see details.
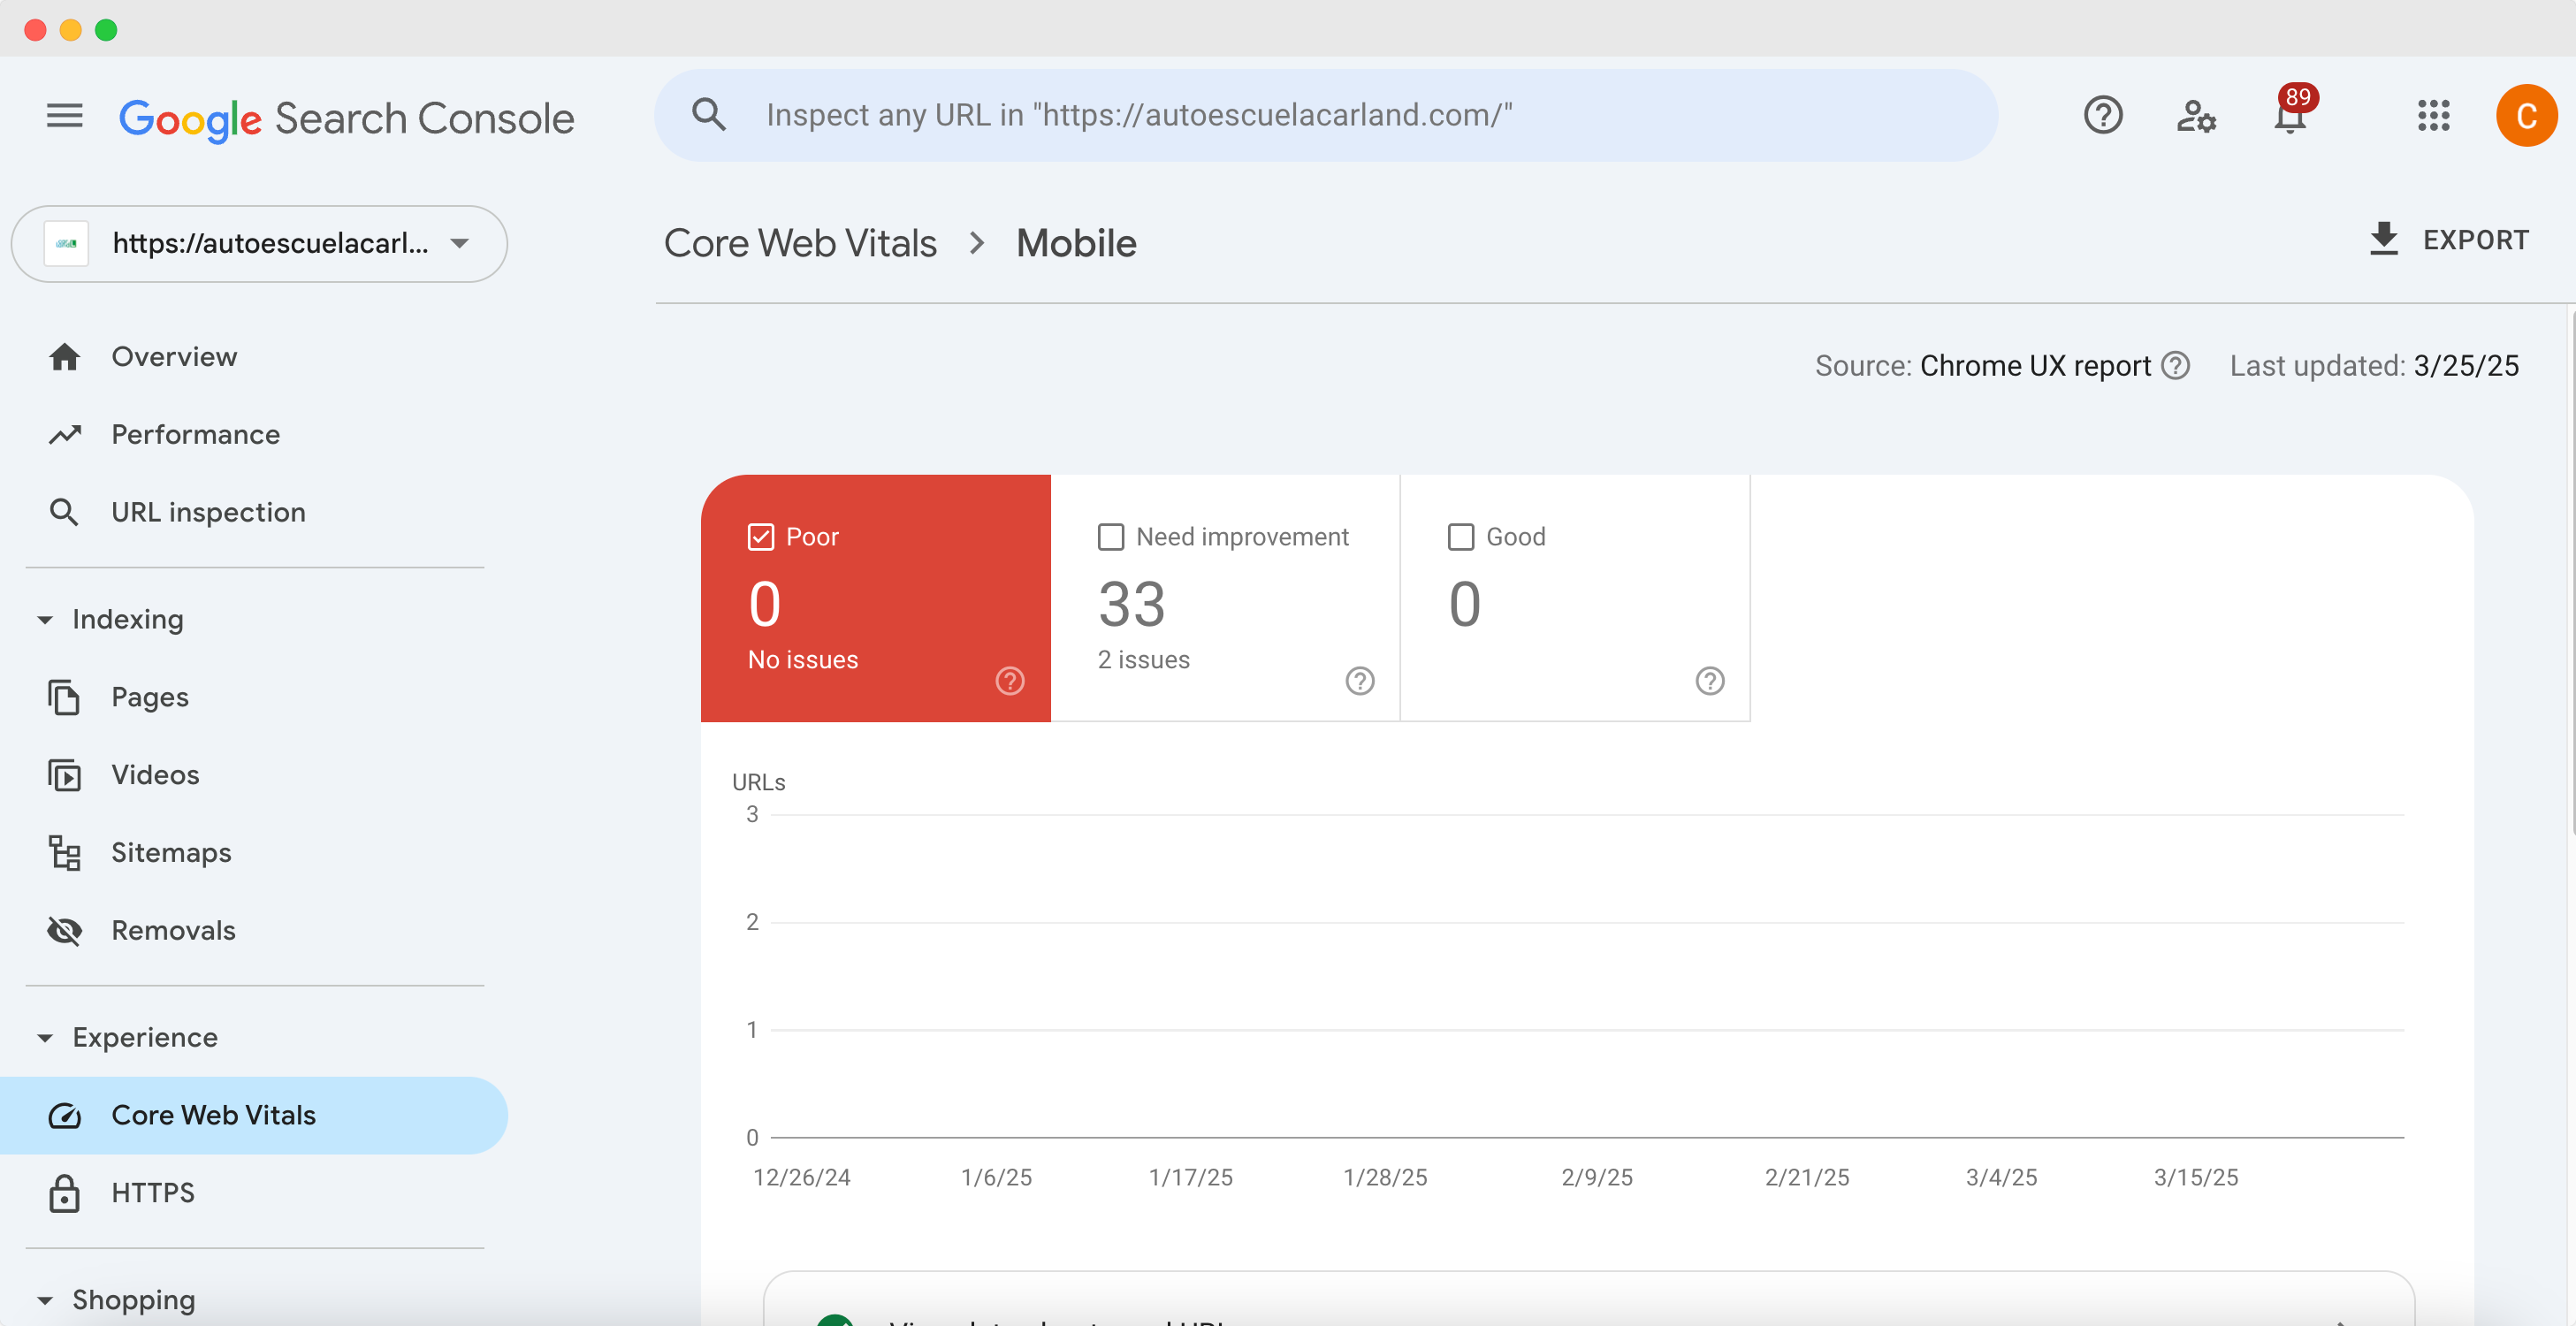
The Core Web Vitals currently consist of three main metrics:
- LCP (Largest Contentful Paint): This measures loading performance – specifically, how long it takes for the largest element (e.g., hero image or big text block) to load within the viewport. A good LCP is under 2.5 seconds on mobile.
- INP (Interaction to Next Paint): This metric (which is replacing the older FID – First Input Delay) measures interactivity – essentially how quickly the page responds when a user tries to interact (like clicking a button). You want this to be fast, ensuring the page isn’t sluggish or unresponsive.
- CLS (Cumulative Layout Shift): This measures visual stability – how much the page layout shifts during load. You’ve probably experienced pages where stuff moves around as you’re trying to click, which is bad UX. CLS quantifies that; a low CLS (ideally < 0.1) is good, meaning the page is stable as it loads.
In the GSC report, URLs that are labeled “Poor” or “Needs improvement” will be grouped by the type of issue (like “Poor LCP on mobile: longer than 4s” or “High CLS on desktop”). You can click those groups to see which URLs are affected.
What to do with this info:
- For any URLs (or groups of URLs) needing improvement, you’ll want to optimize your site: maybe compress images (to improve LCP), optimize your CSS/JS delivery (so the page responds faster for INP), or reserve space for images/ads (to avoid layout shifts for CLS).
- GSC will often integrate with PageSpeed Insights – you might see a link to “Learn more” or a direct link to PSI for a specific issue. That can give more granular suggestions.
- If most of your URLs are “Good” – congrats! Keep monitoring in case site changes affect it.
While Core Web Vitals are important, don’t panic if a few URLs are in the “Needs improvement” bucket. Use the data to systematically better your site’s performance. A fast, user-friendly site not only makes Google happy but also pleases your visitors (who are more likely to stay and convert).
Also under Experience, you might see Mobile Usability (which flags things like clickable elements being too close on mobile, text too small, etc.) – ensure any errors there are fixed for a mobile-friendly site.
Keep in mind, as a blogger or marketer, site speed and usability can impact SEO and user engagement. If your blog takes too long to load, people might bounce, which indirectly can affect rankings. So it’s worth investing some time to hit those green “Good” vitals where possible.
(Need help improving Core Web Vitals or overall site UX? This could be a whole guide on its own, but we cover related tips in our SEO Performance Metrics guide and have resources on site speed optimization.)
Step 8: Leveraging GSC Data for Your Content and SEO Strategy
By now you’ve set up Search Console and learned how to use its core features. Now, how do you turn all this data into actionable strategies to grow your traffic? This section is all about using the insights from GSC to improve your content and SEO performance.
Here are some powerful ways to leverage Google Search Console data:
- Find High-Opportunity Keywords: In the Performance report under Queries, sort by impressions. Look for queries where your average position is around 8-20 (bottom of page 1 or page 2 of Google) and that have a decent number of impressions. These are keywords Google already thinks your site is relevant for, but you’re not in the top spots yet.
Action: Identify pages that correspond to those queries and optimize them. This could mean expanding the content, making it more comprehensive, adding those keywords (and related terms) more prominently, or improving on-page SEO (titles, headers, etc.). Often, a little tuning can bump you onto page 1 where the clicks dramatically increase.
- Boost Pages with Low CTR: Look at queries or pages where your CTR is lower than average despite a good position. For example, if you rank #3 for a query but have a CTR of 2% (which is low for that position), your snippet might not be enticing users.Action: Improve your meta title and description for that page – make sure they are compelling and match the search intent. Sometimes adding a call-to-action, making the title clearer or more specific, or adding a year (if applicable) can attract more clicks. Also consider if rich snippets could help (e.g., FAQ schema to get an expanded listing). We have a whole post on this: How to Improve CTR: Proven Strategies to Skyrocket Your Clicks – give it a read for ideas on boosting your search snippet performance.
- Discover Content Ideas (Content Gap Analysis): GSC can reveal queries that you didn’t intentionally target but are appearing for. You might find, say, a query “easy vegan desserts” showing up because you briefly mentioned it in a post about vegan cooking. If lots of people search that and you only have a small section on it, that’s a hint you could write a dedicated post on “Top 10 Easy Vegan Desserts” to better serve that audience.Action: Export your query data (you can download CSV from GSC) and scan for relevant terms you haven’t covered in-depth. These insights come straight from what people are searching – content marketing gold!
- Improve Existing Content: Your Pages tab might show some articles that used to get traffic but have declined (especially if you compare date ranges). If you see a once-popular blog post now getting fewer clicks, it might be time for a content refresh.Action: Update that content with new information, better examples, current year stats, etc., and re-submit via URL Inspection. Revived content can regain rankings. Also consider adding new sections that address queries you see in GSC that relate to that topic (you can filter the Queries report by page to see all queries a specific page ranks for – this is super useful to understand what else to include).
- Strengthen Internal Linking: Use the Links report (under “Links” in GSC) to see your internal link counts. It shows which pages have the most internal links versus those with few. Make sure important pages (like cornerstone blog posts or key landing pages) have ample internal links from other relevant pages on your site. For example, if you wrote a new ultimate guide, go back to older related posts and link to this new guide. Internal links help Google discover content and also pass link equity, which can improve rankings. They also keep users engaged by guiding them to more content. We dive into this topic in Internal Linking for SEO: How to Build Smart and Effective Links – a recommended read to up your internal linking game.
- Monitor Backlinks and Outreach Opportunities: In the Links report, you also have “External links” which shows sites linking to you, and your top linked pages. While GSC’s backlink data isn’t as exhaustive as dedicated SEO tools, it highlights the major ones. See which content is attracting links, that’s the kind of content you might want to create more of. Also, if a reputable site linked to you once, you might consider reaching out to build that relationship (perhaps they’d link to you again for an even better piece). Conversely, if you see spammy sites linking a lot, you generally don’t need to do anything (Google usually ignores those), but it’s good to be aware.
- Watch for Manual Actions or Security Issues: In the left menu, check “Security & Manual Actions.” Hopefully you never see anything here – but if Google ever has a manual penalty on your site (for spammy practices) or detects your site is hacked or has malware, they will list it here and send an email alert. As part of a good SEO routine, it doesn’t hurt to glance here once in a while and ensure all is clear.
- Use Search Console Insights: Google has a nifty feature called Search Console Insights (accessible from the top of the GSC overview page or via search.google.com/search-console/insights if your GSC is linked with Google Analytics). It provides a simplified, friendly view of your content performance, showing your most popular content, your newest content and how it’s trending, and how people find you (top queries leading to your content). It’s great for a quick content-focused snapshot. Marketers can use it to quickly show content creators which posts are killing it or which new posts gained traction.
- Combine GSC with Google Analytics data: For an even deeper dive, link your GSC with Google Analytics (in GA4, you can integrate Search Console in the GA admin settings). This lets you see GSC metrics alongside site engagement metrics (bounce rate, time on page, conversions, etc.). For example, you could see if the traffic coming from a certain query actually spends time on your site or converts. This can inform your content strategy, attracting the right kind of traffic, not just any traffic.
- Use GSC data with other SEO tools: GSC is fantastic, but it only shows Google search data. Consider using other tools in conjunction for instance a keyword research tool to find new keywords (then track if you start getting impressions for them in GSC), or a rank tracker to monitor specific keywords daily. You can also use something like Google Data Studio (Looker Studio) to create a dashboard combining GSC and other data for reporting to your team or clients.
- Keep a Regular SEO Routine: Make it a habit to check Search Console at least once a week. This way, you catch any issues (like a sudden spike in errors or a drop in clicks) early. Also, review monthly to see which pages gained or lost traffic and adjust your strategy accordingly (update content, do more promotion, etc.).
Remember, data from GSC is only as good as the actions you take from it. The goal isn’t just to admire the numbers, but to continuously optimize your site: fix technical issues, refine your content, and ultimately create a better experience that will improve your search visibility.
Analyze your domain's health score and fix all issues with a single click.
Final Words
Google Search Console is a must-have tool for bloggers and marketers serious about SEO. It might seem a bit overwhelming at first, but by following this step-by-step guide, you should now be able to:
- Set up GSC and verify your site,
- Submit a sitemap so Google can crawl your content,
- Monitor your search performance (and understand what those clicks and impressions mean),
- Spot and fix indexing problems that could be holding your site back,
- Use the URL Inspection tool to get your new content indexed faster and debug issues,
- Track Core Web Vitals to ensure your site is fast and user-friendly,
- and most importantly, use all this data to continually refine your content and SEO strategy.
SEO is an ongoing process, and Google Search Console is like your constant companion giving you feedback. As you publish new blog posts or launch marketing campaigns, check GSC to see how they perform. It’s incredibly rewarding to see your impressions and clicks rise over time as you implement improvements.
Lastly, don’t forget to combine GSC insights with your creativity and other tools. GSC tells you what’s happening – the next step is on you to tweak and experiment with your content, keywords, and site fixes to move those numbers in the right direction. Keep an eye on trends, listen to what the data is saying, and you’ll be on your way to SEO success.