If you’re investing time and resources into SEO, you need to know if those efforts are paying off. Tracking SEO performance metrics is how you gauge your progress and identify what’s working (and what isn’t)
By monitoring these data points, you can make informed, data-driven decisions to improve your search rankings and organic traffic. In this guide, you’ll learn how to measure search engine optimization results in an actionable way, covering the most important SEO metrics to track, why they matter, and how to analyze them.
Analyze your domain's health score and fix all issues with a single click.
We’ll also look at tools (from Google Search Console to Semrush and ClickRank) that make SEO tracking and reporting easier. Whether you’re wondering how to measure SEO performance, how to measure SEO success, or simply looking for better SEO reporting metrics, this article will walk you through the process step by step.
Why SEO Performance Metrics Are Important: Measuring the right metrics is vital because it ties your SEO work to actual business outcomes.
Without tracking, you’re essentially “flying blind” you won’t know which optimizations boost your visibility or conversions. Good SEO measurement lets you determine the effects of changes on your site and prove the value of your SEO strategy to stakeholders.
In fact, if you work with clients or management, being able to show improvements in key metrics (like higher rankings, more organic traffic, or increased leads) is crucial for demonstrating ROI. Simply put, monitoring SEO performance helps you understand how to measure SEO results and success in concrete terms, so you can double down on tactics that work.
Keep in mind that not all data points are equal, some are mere metrics, while others are true KPIs (Key Performance Indicators) of success. (All KPIs are metrics, but not all metrics are KPIs.)
For example, impressions are a metric, but the conversion rate from organic traffic is a KPI that directly reflects goal achievement
The indicateurs SEO (French for “SEO indicators”) you choose to focus on should align with your business goals. Tracking these over time reveals trends and “big picture” progress.
Now, let’s dive into the specific metrics that matter most for SEO and how to measure SEO performance effectively for each.
Key SEO Performance Metrics to Track and Measure
What are the most important SEO metrics you should be tracking? Below is a breakdown of critical SEO metrics (and why they matter), including SEO tracking tips for each. These cover everything from visibility on search engines to user engagement and conversions. By keeping an eye on these SEO reporting metrics, you’ll have a comprehensive view of your SEO success.
1. Organic Traffic (Clicks and Visits)
Organic traffic is the lifeblood of SEO, it measures how many visitors come to your website through unpaid (“organic”) search results In other words, these are the users finding your site on Google (or other search engines) and clicking through to your content.
This metric is a direct indicator of SEO success because higher organic traffic means your SEO efforts are resulting in more people reaching your site.
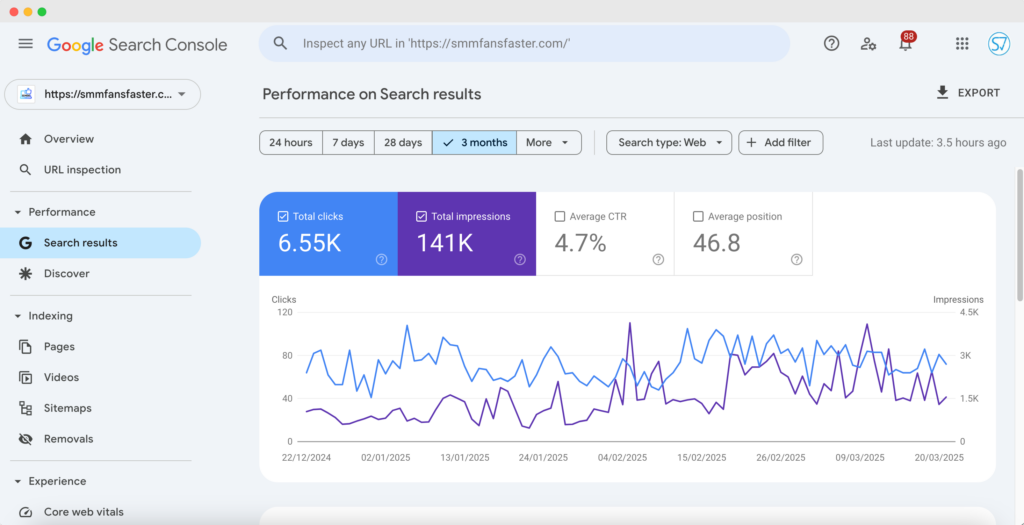
You can measure organic traffic in a couple of ways. In Google Search Console (GSC), the Performance report shows the number of clicks your site received from Google search results.
Each click represents a user visiting your site via an organic listing. GSC is handy for tracking clicks at the query or page level over time. In Google Analytics 4 (GA4), you can also see organic traffic by looking at the “Organic Search” segment of your Acquisition reports.
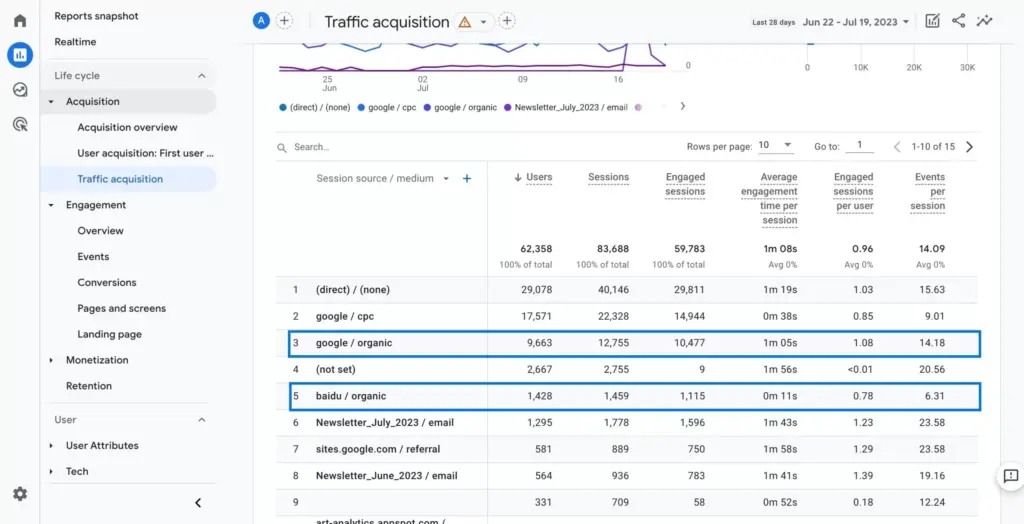
GA4 will show you the number of sessions or users from organic search (make sure to filter for the “Organic Search” channel). For example, in GA4’s Traffic Acquisition report, you can compare how many sessions came from Organic Search versus other channels in a given period. This helps you gauge what share of your overall site traffic is driven by SEO.
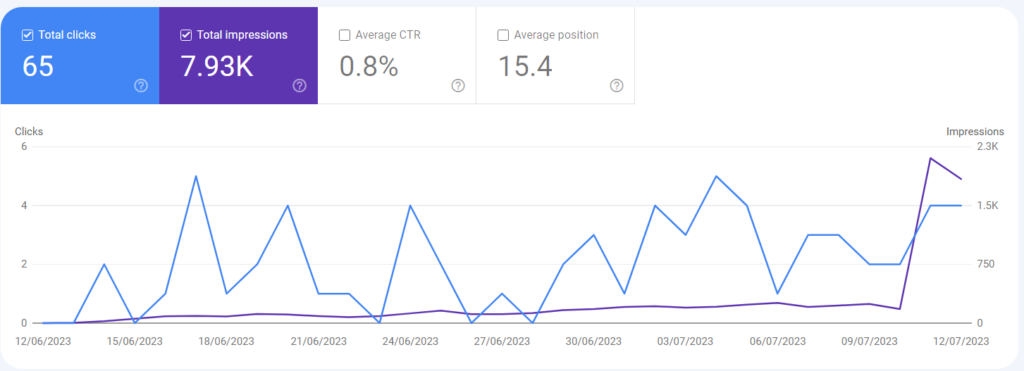
Google Search Console “Performance” report example, showing total clicks (blue line) and total impressions (purple line) trending over time.
In GSC, clicks represent how many users visited your site from search results, while impressions indicate how often your site appeared in results.
Monitoring organic traffic over time is essential. Look for trends: is your traffic growing month over month? Did a recent content update or SEO campaign cause a noticeable uptick in visits?
Also compare your organic traffic to industry benchmarks or competitors if possible. For instance, if competitors are getting significantly more organic visits, it might signal they rank for valuable keywords you haven’t tapped into.
Tools like Semrush’s Traffic Analytics can estimate competitors’ organic traffic for comparison. Ultimately, steady growth in organic traffic is a strong sign of SEO health.
If traffic is flat or declining, you may need to investigate your rankings, content, or technical issues that could be holding you back.
How to track it: Use Google Search Console for quick click counts and trend graphs (as shown above), and use Google Analytics to analyze on-site behavior of organic visitors (bounce rates, pages per session, etc., which we’ll cover later). Many SEO professionals also set up dashboards or reports (e.g., in Google Looker Studio or using SEO tools) to report on organic traffic as a key metric. The goal is to keep an eye on how your unpaid search visits are growing and how they translate into engagement or conversions.
2. Keyword Rankings (Search Engine Positions)
Your website’s keyword rankings: i.e. where your pages appear on the Search Engine Results Pages (SERPs) for specific search queries are a fundamental SEO metric.
High rankings (position #1, #2, #3, etc.) for relevant keywords mean greater visibility, which typically leads to more traffic. Many SEO campaigns revolve around improving keyword rankings for terms that your target audience is searching. Monitoring your positions in search results tells you if your optimizations are moving the needle.
In Google Search Console, you can see an average position for each query your site ranks for.
This “Average position” metric is useful to gauge your general ranking status, but it’s an average of many keywords, so you’ll likely want to track specific important keywords individually.
GSC allows filtering by query to see how a particular keyword is performing (impressions, clicks, CTR, and average position for that term). For more robust rank tracking, SEO tools are commonly used. Google Search Console provides basic ranking info (and it’s free), but it doesn’t track competitor positions or allow easy tracking beyond 16 months of data.
That’s where dedicated rank tracking tools come in.
Third-party SEO tools like Semrush, Ahrefs, or Moz can automate keyword tracking and provide daily updates on your rankings .
For example, Semrush’s Position Tracking tool lets you input a list of keywords and then monitors your rank for those terms each day . These tools often also give you a “visibility” score, an aggregate metric indicating what percentage of all possible clicks you are capturing across your tracked keywords.
Visibility is expressed as a percentage (100% meaning you’d hypothetically rank #1 for all your keywords). It’s a handy way to summarize ranking performance in one number, though you should still dive into individual keyword trends.
When tracking rankings, focus on your priority keywords, those that are most relevant to your business and have decent search volume. Keep an eye on both branded keywords (searches that include your brand name) and non-branded (generic) keywords.
Branded terms often rank easily if your brand is unique, but non-branded keywords indicate how well you rank on broader topics in your niche. Also, consider tracking long-tail keywords (more specific phrases) which can collectively drive a lot of traffic.
Why it matters: If you notice a keyword climbing from page 3 to page 1 of Google, that’s a big SEO win that should correspond with more traffic.
Conversely, if a high-traffic keyword drops in ranking (say from #2 to #9), you can expect a dip in traffic, and you’ll want to investigate why (did a competitor outrank you? Was there an algorithm update? Did your page’s content or links change?).
By continuously tracking rankings, you can react to fluctuations quickly and prioritize your SEO efforts. As the saying goes, “what gets measured gets improved.” Regular rank tracking ensures you’re aware of your SEO progress and can react to maintain or improve your search presence.
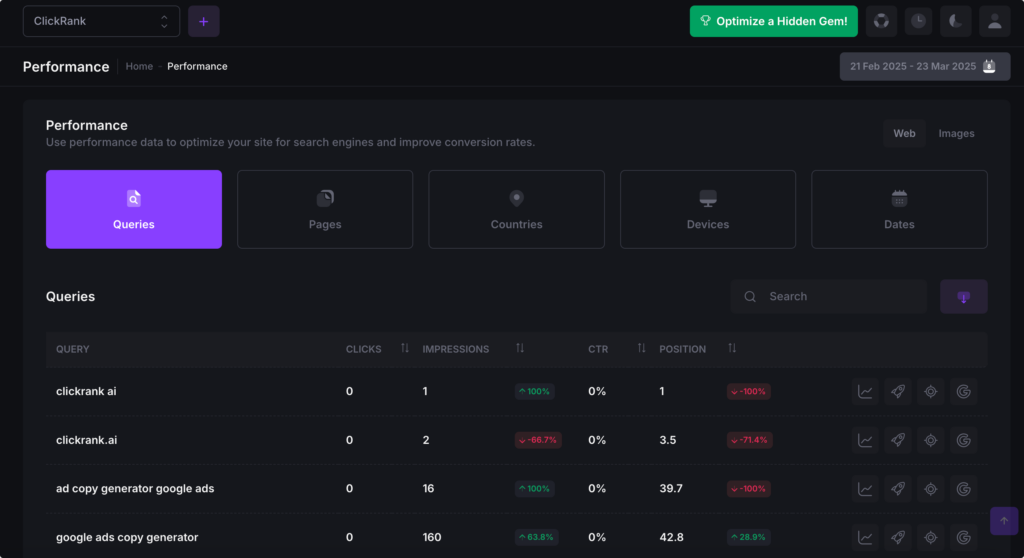
How to track it: At minimum, use Search Console’s Queries report to monitor your average positions and identify which queries you rank well for (and which need improvement). For a more advanced approach, use a tool like Semrush, Ahrefs, or ClickRank.ai (more on this later) to set up a keyword tracking campaign. These platforms often send updates or have dashboards so you can check your rankings anytime. They also might track local rankings (if location is relevant) and mobile vs desktop rankings, which can be important distinctions.
3. Organic Impressions (Search Visibility)
An organic impression is counted every time a page from your website appears in a user’s search results. Even if the user doesn’t click your result, it still counts as an impression if your listing was seen on the SERP.
Impressions measure your potential reach or visibility in search. This metric answers the question: How often are searchers seeing my pages in results?
Impressions are one of the earliest indicators of SEO performance. You might start seeing impressions for a new page before it ever gets clicks – it means Google has indexed the page and is showing it for some queries. If your impressions are growing, it often signals that your content is being shown for more keywords or higher positions, even if clicks haven’t caught up yet .
For instance, after publishing a new blog post, you might notice its impressions rising as it starts to rank for various search queries. This is a good sign that your SEO content is gaining traction.
However, not all impressions are equally valuable. You should consider which queries are generating those impressions. If your page is appearing for highly relevant searches, that visibility is great.
But if it’s showing up for irrelevant searches (e.g. a blog post accidentally ranking for an unrelated term), those impressions might never convert into clicks.)
It’s important to pair impressions with click-through rate (CTR, next metric) to gauge effectiveness. As a simple example, if your page got 1,000 impressions but only 1 click, it means people saw your listing but almost no one clicked – possibly indicating the keyword wasn’t very relevant or your snippet (title/meta) wasn’t enticing.
In Google Search Console, you can view total impressions in the Performance report and filter them by page or query. You can also compare impressions over two time periods to see if your visibility is increasing.
If one of your key pages isn’t getting many impressions, that tells you it’s not being shown often, you might need to optimize it for more relevant keywords or improve its SEO so it ranks higher (higher rank usually = more impressions). On the other hand, if impressions are high but clicks are low, that brings us to CTR.
How to track it: Google Search Console is the primary source for impression data
In GSC’s Performance tab, ensure “Total Impressions” is checked to see the count. You can sort queries by impressions to see which searches yield the most visibility for your site.
Some SEO tools also pull Search Console data and might display impressions in their interface. The key is to monitor impression trends for important pages/queries. A rising impressions graph (like the purple line in the GSC screenshot above) is usually a positive sign that your overall search visibility is growing.
4. Click-Through Rate (CTR)
Click-through rate (CTR) is the percentage of impressions that resulted in a click to your site. In formula terms: CTR = (clicks / impressions) * 100%.
For example, if a page appeared in search results 100 times and got 5 clicks, the CTR is 5%.
This metric essentially measures how effective your search snippets (title, meta description, etc.) are at convincing searchers to click, as well as how relevant your result is for the query.
CTR is a crucial metric because a high CTR means when people see your page in search results, they often click it – indicating your listing is appealing and likely matching search intent.
A low CTR means many people see your site but few click through, which could suggest a mismatch or an unenticing snippet. Improving CTR can often lead to quick wins in SEO: you’re not even changing rankings, just getting more out of the impressions you already have.
Several factors influence CTR: the title tag and meta description you’ve written (does it grab attention and include the keyword?), the URL and breadcrumbs (are they user-friendly?), and even rich snippets or schema enhancements (like star ratings or FAQs) which can make your result stand out.
The position on the page also affects CTR. naturally position #1 gets a higher average CTR than position #9. But even at a given position, a well-crafted title can significantly outperform a bland one in terms of CTR.
In Google Search Console, CTR is calculated for each query and page. You can, for instance, filter GSC to a specific page to see its CTR for all queries, or vice versa. If you notice a page has a much lower CTR than site average (or below what you’d expect for its position), that’s a flag to optimize its snippet. Maybe the title tag can be made more compelling or the meta description can better address what users are looking for. Even subtle tweaks like adding a call-to-action in the meta description or ensuring the title isn’t cut off can help.
As a benchmark, overall organic CTR for a site might be around 2%–3% in some industries
(it varies by industry and brand; known brands often get higher CTRs because searchers recognize the name).
Individual pages that rank #1 for their keyword might see CTRs of 30% or more, whereas pages ranking lower will have smaller CTR percentages.
The key is to improve CTR relative to your current position. If you move from 3% to 5% CTR on a high-impression keyword, that’s a significant jump in traffic without even changing rank.
How to track it: Use Search Console’s Performance report it will display CTR alongside clicks and impressions for queries and pages. Sort or filter to find low CTR instances on important queries.
You can also monitor changes after making snippet optimizations: for example, if you rewrite a title tag, check the CTR a few weeks later to see if it improved for that page’s queries.
Some SEO tools (and ClickRank performance features) make this easier by highlighting pages with high impressions but low CTR (so you can target them for improvement). Remember that improving CTR not only brings more traffic but could indirectly boost rankings too, Google’s algorithm may use engagement signals like CTR as a ranking factor, at least to some extent, through user satisfaction metrics.
5. Conversions and Goal Completions
Ultimately, traffic and rankings are means to an end. The end goal of SEO is usually to drive valuable actions on your website – in other words, conversions. A conversion is whatever you define as a meaningful success action for your site. It could be an e-commerce purchase, a lead form submission, a newsletter sign-up, a download, or any action that has value to your business. Tracking conversions from organic search visitors is how you measure SEO success in business terms.
It’s important to set up conversion tracking (goals or events) in your analytics platform so you can attribute how many conversions come from organic traffic. In GA4, for example, you can mark certain events as “Conversions” (like a form submission event).
Then you’ll be able to see how many conversions occurred and how many were from Organic Search users. If you’re using an older Universal Analytics, you would set up Goals (or E-commerce tracking) similarly. The specifics vary, but the idea is to measure the end results.
Key metrics here include the number of conversions from organic traffic and the organic conversion rate (the percentage of organic visits that convert). For instance, if in a month you had 1,000 organic visits and 50 of them filled out a lead form, that’s 50 conversions with a 5% conversion rate for organic traffic.
This is a crucial KPI because it ties SEO to revenue or lead generation. You might find that even though Organic Search is one of your largest traffic sources, its conversion rate is lower or higher than other channels – insights like that can shape your strategy (maybe the organic audience needs different calls-to-action or content alignment to convert).
When reporting on SEO performance, especially to non-SEOs or executives, conversion metrics resonate the most. Showing that “SEO brought in X purchases or Y new sign-ups this quarter” is far more impactful than just saying “we got Z more clicks.” It connects SEO to business growth.
Keep in mind that conversion tracking requires proper setup. Make sure your analytics is configured to track the forms, sales, or events that matter. Also, consider the attribution window – sometimes a user might find you via organic search but convert later via a different channel (or vice versa). However, as a baseline, last-click organic conversions are a solid starting point.
If your website doesn’t have a traditional “conversion” (for example, a blog that earns revenue via pageviews/ads), you can set up an engagement-based goal (like viewing at least 3 pages, or spending 2+ minutes). But most business websites will have some conversion action to measure.
How to track it: Google Analytics 4 is the go-to for tracking conversions by channel. In GA4’s standard reports, under Acquisition > Traffic Acquisition, you can add a column for “Conversions” (if you have conversions defined) to see how many each channel brought in.
You can also build a custom exploration in GA4 or a Looker Studio dashboard focusing on Organic Search conversions. Additionally, some SEO tools integrate with analytics or allow you to input goal values to calculate things like estimated SEO ROI. The key is to routinely check how your organic traffic is translating into results.
If you notice, for example, that organic conversion count is rising month over month, that’s a strong validation of your SEO strategy. On the flip side, if traffic went up but conversions didn’t, you may need to attract more qualified traffic or improve your site’s ability to convert visitors (which could involve CRO, conversion rate optimization which is beyond pure SEO).
(Tip: Tracking SEO performance isn’t just about visits but also the quality of those visits. A smaller amount of highly converting organic traffic can be more valuable than loads of unengaged traffic. Always pair traffic metrics with conversion metrics for the full picture of how to measure SEO success.)
6. Bounce Rate and User Engagement
Getting traffic to your site is half the battle, what visitors do after they arrive is the other half. User engagement metrics tell you how well your site content satisfies visitors and whether they stick around.
One commonly watched metric is bounce rate, which is the percentage of visitors who leave after viewing only one page (no further interaction).
A high bounce rate can indicate that people didn’t find what they were looking for, or the page experience wasn’t compelling enough to continue.
Conversely, engagement rate (a GA4 metric) measures the percentage of sessions that were “engaged”, by default, GA4 counts a session as engaged if the user spent 10+ seconds, or had a conversion event, or viewed 2 or more pages. Think of engagement rate as the opposite of bounce rate.
Other engagement metrics include average time on page, pages per session, scroll depth, and exit rate (how often a page is the last in the session).
These aren’t strictly SEO ranking metrics, but they relate to SEO performance in that they reflect content quality and relevance. Google’s algorithm aims to rank content that best satisfies user intent.
If users consistently leave your page quickly (high bounce) and don’t engage, it could indirectly affect your SEO over time (for instance, through lower user satisfaction signals or fewer conversions which lead to less business success from SEO).
For SEO purposes, you’ll want to monitor the engagement of organic visitors specifically. GA4 allows you to filter or compare traffic by source, so you can see metrics for “Organic Search” users.
For example, if your overall bounce rate is 50% but organic search visitors bounce at 65%, that might indicate a mismatch – perhaps some SEO keywords are bringing the wrong audience, or the landing pages ranking for those keywords need improvement to better serve what searchers expect.
Keep engagement metrics in context. A “high” or “low” bounce rate is relative to the page’s purpose. A blog post might naturally have a higher bounce rate (someone got their answer and left) whereas a product page should ideally lead the user to click deeper (add to cart, etc.).
Instead of obsessing over an arbitrary bounce rate number, use it to identify extremes. For instance, identify pages with unusually high bounce rates or very short time on page from organic visitors, those could be targets for content improvement.
Maybe the content is off-topic, or the page load speed is slow (which causes users to abandon), or it lacks a clear next step for the user. On the flip side, pages with very high engagement (low bounce, long time on page) are likely doing something right – learn from those.
Google Search Console doesn’t report engagement metrics, so you’ll get this data from your analytics (GA4). In GA4, instead of bounce rate, you have “engaged sessions” and “engagement time.”
If you still want to see a bounce-like metric, GA4 actually reports “engagement rate,” and you can interpret a lower engagement rate as a high bounce rate. (For reference, if Universal Analytics had a 70% bounce rate, GA4 might show a 30% engagement rate – roughly the inverse.)
How to track it: Use Google Analytics 4 to monitor how organic search users behave. Key GA4 metrics include Engagement time per session (how long they spend on average) and Engaged sessions per user.
You can also derive “bounce rate” in GA4 (some reports now directly show bounce rate as the complement of engagement rate). Watch these metrics for important landing pages.
If your SEO landing pages have poor engagement, it might be worth analyzing why. Sometimes the issue might be technical (e.g., slow mobile loading speed leading to bounces) or content-related (the content doesn’t match what the searcher hoped to find).
By improving user engagement on your pages, you not only improve the chances of converting those visitors but may also improve your SEO in the long run (happy users can mean better word-of-mouth, more backlinks, and potentially better performance on search if user engagement is a ranking consideration).
7. Backlinks and Domain Authority
Backlinks: links from other websites pointing to your site – remain one of the most important off-page SEO metrics. Search engines view backlinks as “votes of confidence” for your content. In general, the more high-quality, relevant backlinks a page (or site) has, the higher it can rank, because those links convey authority.
Domain Authority: (a term coined by Moz) or similar scores like Semrush’s “Authority Score” or Ahrefs’ “Domain Rating” attempt to quantify the overall backlink strength of a site. While these scores are third-party metrics (Google doesn’t use a public “domain authority” number), they are useful for benchmarking the relative authority of your site versus competitors.
Tracking your backlink profile is crucial for SEO performance monitoring. If you launch a link-building campaign or earn some PR mentions, you’ll want to see the number of backlinks (and referring domains) increase over time.
Conversely, if you lose backlinks (for instance, a site that linked to you got shut down or removed the link), that could hurt your authority. It’s good practice to keep an eye on lost & gained backlinks.
You can use free tools like Google Search Console (the Links report) to see some of your backlinks, but GSC’s link reporting is limited. It’s often better to use dedicated SEO tools for backlink tracking.
Ahrefs and Semrush: both have robust backlink analytics. They can show you the total number of backlinks, the number of referring domains (more important than total links, as 100 links from one domain count as one referring domain usually), and the quality of those links. These tools also give you an authority score.
For example, if your Domain Authority (DA) is 45 today and through content promotion and outreach you build new links, you might see it climb to DA 50+ over months – indicating growing site authority. Keep in mind each tool’s metric is on its own scale, so it’s more useful for comparisons and tracking over time than as an absolute measure.
Why it matters: Backlinks directly influence your rankings. If two sites have equally great content, the one with more quality backlinks will typically outrank the other. By tracking backlinks, you measure the off-page strength of your SEO. It also helps identify opportunities
if a competitor has 100 domains linking to them and you have 20, there’s room to catch up. Additionally, backlink analysis can reveal which content on your site is attracting links.
Perhaps one of your blog posts naturally earned a lot of backlinks – that’s a clue that the topic or the content was link-worthy, and you might build on that success with related content.
Also, keep an eye on the quality of backlinks. A few links from authoritative sites (like news outlets, .edu domains, respected industry blogs) can outweigh dozens of links from low-quality sites.
Some tools give each backlink a quality score. If you find spammy backlinks, you might need to disavow them via Google’s disavow tool to prevent any potential negative impact (though Google is pretty good at ignoring bad links algorithmically these days).
How to track it: Utilize tools like Semrush Backlink Analytics or Ahrefs Site Explorer to get a detailed view of your backlinks. Set up periodic checks (some tools can send alerts when you gain or lose backlinks).
Note your domain’s authority score and how it changes over time as you acquire more links.
You can also track specific pages: for instance, monitor backlinks to a key landing page that you’re actively promoting. Many SEO professionals include backlink metrics in their SEO reporting metrics to clients – such as number of new referring domains this month, domain authority progress, etc., as it demonstrates off-page SEO efforts.
8. Technical SEO Metrics (Site Health & Core Web Vitals)
Technical health underpins your site’s ability to rank and provide a good user experience. Technical SEO metrics might not be as glamorous as traffic or conversions, but they are extremely important to track, because technical issues can stall your entire SEO progress.
Key technical metrics and indicators include things like your site’s crawlability (are search engines able to effectively crawl and index your pages?), the absence of critical errors (404 pages, broken links), page speed and Core Web Vitals (loading performance, interactivity, and stability measures), mobile-friendliness, and overall site health score as given by SEO audit tools.
Many SEO tools will generate a Site Health or Site Audit score for example, Semrush’s Site Audit gives a percentage score based on the number of issues found vs. total checks.
While the exact score is not a direct Google metric, it’s a useful composite metric to track. If your site health score is, say, 80% and you fix a bunch of technical SEO issues (duplicate meta tags, missing alt text, slow pages, etc.), you might raise it to 90%+.
This indicates a healthier site which is less likely to be held back by technical problems.
Core Web Vitals are a set of specific performance metrics defined by Google (Largest Contentful Paint, First Input Delay, and Cumulative Layout Shift) that measure user experience aspects of loading speed, interactivity, and visual stability.
They have become ranking factors as part of Google’s page experience signals. So, tracking your Core Web Vitals scores (accessible in Google Search Console’s Page Experience report or tools like PageSpeed Insights) is important.
If your site’s LCP (Largest Contentful Paint) is 5 seconds (which is poor) and you optimize images or implement caching to get it down to 2.5 seconds (good), you can expect not only a better user experience but potentially an SEO boost.
Other technical metrics to monitor include index coverage (in GSC, ensure important pages are indexed and note any that are excluded due to errors), mobile usability issues (also in GSC’s Mobile Usability report), and security aspects (having HTTPS, no intrusive interstitials, etc.).
While it’s a lot to take in, most of this can be handled by running periodic site audits with tools. These audits will flag issues like missing meta descriptions, slow pages, broken links, images without alt text, etc., and often assign a severity level.
Why it matters: Even the best content won’t rank if your site has major technical flaws. For example, if your site is frequently down or very slow, Google might crawl it less often and rank it lower.
If your pages aren’t indexed due to a faulty robots.txt or sitemap, you won’t appear in search at all. Technical SEO metrics are the foundation, they ensure your site can be accessed and understood by search engines and that users have a good experience.
Google has explicitly stated that page experience (which includes speed and mobile-friendliness) is part of its ranking algorithm, so ignoring these metrics could put you at a disadvantage.
How to track it: Take advantage of SEO audit tools. Semrush, Ahrefs, Moz, and others have site audit features that scan your site and report on dozens of technical metrics, giving you a “health score”.
They often allow scheduling audits (e.g., monthly) so you can track improvements over time. Google Search Console should be checked for any Coverage errors or warnings regularly. Also, use Google’s PageSpeed Insights or Lighthouse (built into Chrome DevTools) to get Core Web Vitals metrics for your pages.
If you find areas to improve (for instance, LCP is poor on key pages), work with your dev team or use site optimization techniques to fix them, then track the metric again. Some improvements (like fixing errors) you can accomplish quickly; others (like overall site speed) might be an ongoing effort.
In any case, include technical KPIs in your SEO tracking. Many marketers include a brief technical status in their SEO reports, for example: “Site Health score: 92% (up from 85% last quarter), 0 critical errors, Core Web Vitals: Good on 80% of pages” this shows that the site’s foundation for SEO is strong and improving.
By monitoring all the above metrics – from traffic and rankings to engagement, links, and technical health – you get a 360° view of SEO performance. Now, let’s discuss how you can conveniently track these metrics and which tools can help streamline the process.
Tools and Methods for Tracking SEO Performance
You might be thinking, “That’s a lot of metrics… do I need to check all of these in different places?” The good news is there are integrated ways to gather and analyze this data. Marketers typically rely on a combination of free Google tools and paid SEO platforms to monitor SEO metrics.
Google Search Console (GSC) and Google Analytics 4 (GA4) are the two foundational (and free) tools for SEO measurement.
GSC provides insights on how your site is performing in Google Search: it’s where you see search impressions, clicks, CTR, and average position for queries and pages, as well as index coverage and issues.
GA4 on the other hand, tells you what those users did on your site: engagement, conversions, bounce rate (engagement rate), etc. together with traffic numbers. Between GSC and GA4, you can cover a lot of ground in measuring SEO results.
For example, you might use GSC to find the top queries driving traffic, then look in GA4 to see how the traffic from those queries behaves on your site (do they convert? do they browse multiple pages?).
For deeper insights and efficient reporting, many marketers turn to SEO software platforms. These include well-known tools like Semrush, Ahrefs, Moz, and specialized rank trackers or analytics tools. Here’s a quick comparison of a few alternatives:
- Semrush: A comprehensive SEO suite that offers rank tracking, keyword research, site auditing, backlink analysis, and competitor benchmarking. Semrush is excellent for pulling together various metrics, you can track keyword positions daily, conduct site health audits, and even integrate Google Analytics/Search Console to build reports. It has a robust reporting interface, so for SEO reporting metrics it’s quite handy (for instance, creating PDF reports for clients). Semrush also provides a “Visibility %” metric and tons of SEO data in one place. The downside is it’s a premium tool with a learning curve, and you might not need all its features if you’re only focused on a subset of metrics.
- Ahrefs: Another top-tier tool known especially for its backlink database and keyword research. Ahrefs offers rank tracking and site audits too, but many SEOs love it for analyzing backlinks and content gaps. If your focus is off-page metrics like backlinks and content optimization, Ahrefs is powerful. It also has its own version of authority (Domain Rating). Pricing is similar range to Semrush (not cheap for full features), but it’s very data-rich.
- Moz: Moz Pro includes rank tracking, site crawl, and their famous Domain Authority metric for link analysis. It’s user-friendly and their metrics (like DA or Spam Score) are often used in reporting. Moz’s keyword tracking might be a bit less granular than Semrush/Ahrefs, but it’s still a solid all-around tool.
- Google Search Console & Analytics (combination): Some marketers on a tight budget stick mostly to these free tools, manually exporting data or using connectors to something like Google Looker Studio to create dashboards. This is doable – for example, you can pull GSC data (clicks, impressions, CTR, position) and GA4 data (conversions, etc.) into a single dashboard. It just may require more manual setup and doesn’t automatically track competitors or backlinks, etc.
Using multiple tools can be time-consuming. You might find yourself bouncing between GSC, GA, Semrush, etc., to compile a complete report. That’s where an integrated solution like ClickRank.ai comes into play, aiming to consolidate your SEO tracking and reporting in one platform.
Tracking and Improving SEO Performance with ClickRank.ai
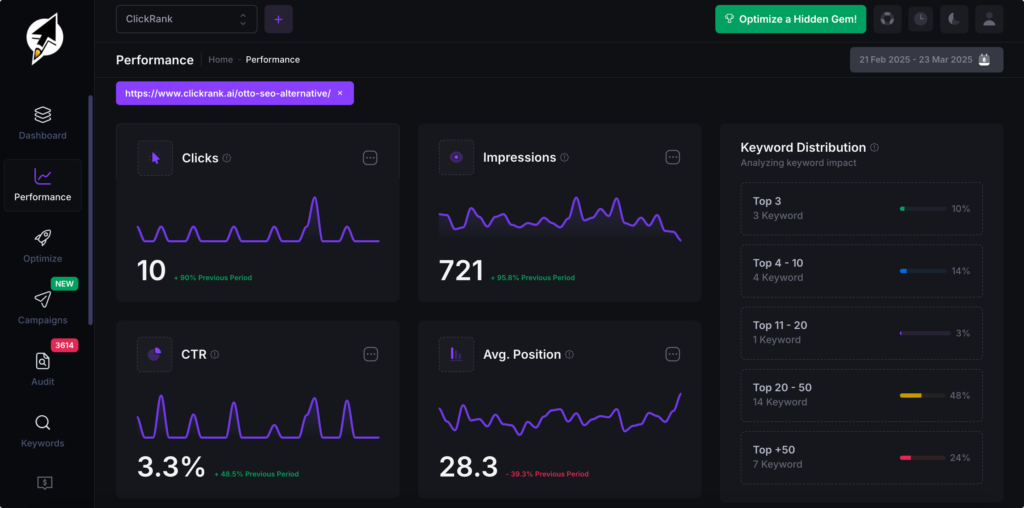
One recommended solution to streamline your SEO performance tracking is ClickRank.ai. ClickRank.ai is an SEO platform designed to bring all your key SEO metrics into one unified dashboard and provide actionable insights. It particularly shines in its Performance features, which are built to help marketers monitor and improve SEO results without heavy lifting.
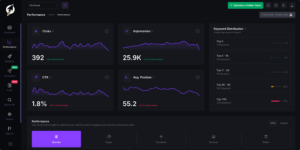
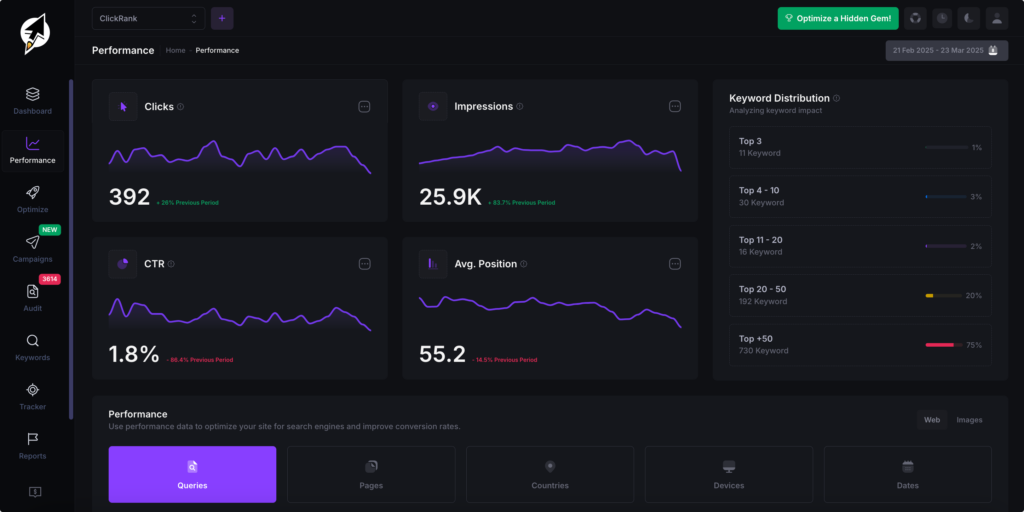
Centralized Performance Dashboard: ClickRank.ai’s Performance section gives you an at-a-glance view of how your site is doing across crucial metrics like clicks, impressions, click-through rate, and average position, all in one place (How to Use ClickRank to Analyze Performance by Page | ClickRank Helpdesk). Instead of checking Google Search Console separately, ClickRank pulls in that data and presents it in a user-friendly interface. You can easily toggle between different views:
- By Page: See how each individual page on your website is performing in search. The Pages view highlights metrics per page (clicks, impressions, CTR, average position, and even an estimated traffic metric) so you can identify your top-performing pages as well as pages that may need attention (How to Use ClickRank to Analyze Performance by Page | ClickRank Helpdesk). For example, you can quickly spot if a critical landing page is underperforming (low clicks or CTR) compared to others.
- By Keyword (Query): Analyze performance for each search query bringing traffic. This helps you see which keywords are your biggest traffic drivers and how your ranking and CTR for those queries change over time.
- By Country: If you have an international audience, ClickRank can break down your performance by country, showing you where you’re getting the most impressions and clicks. This is great for global SEO strategies – you might discover new market opportunities if, say, your site is unexpectedly popular in a country you haven’t specifically targeted.
- By Device: The device view lets you compare desktop vs mobile performance. You can ensure your mobile SEO is on par. If you see discrepancies (e.g., great desktop rankings but poor mobile), it might indicate mobile usability issues to fix.
- By Date/Time: You can analyze trends over specific date ranges or see how metrics evolve over time (like week over week, month over month). This makes it easy to measure the impact of an SEO campaign or Google algorithm updates – just compare before-and-after date ranges.
The ClickRank.ai Performance dashboard (Pages view) summarizing SEO metrics for each page over the selected date range. Here you can see URL pages listed with their clicks, impressions, CTR, average position, and estimated traffic, along with percentage changes. This consolidated view helps you quickly identify which pages drive organic traffic and which might need optimization.
Actionable Insights and Optimization: What sets ClickRank.ai apart is that it doesn’t just display metrics – it helps you act on them. In the Performance tables, you have the ability to take quick actions directly.
For instance, if you notice a page with a lot of impressions but a poor CTR, ClickRank offers suggestions to optimize the title or meta description of that page. You can often initiate certain on-page optimizations right from the dashboard (a unique feature that saves time).
This means you can go from insight to action in one interface, see a problem, fix it on the spot. For busy marketers, this streamlines the workflow dramatically.
Keyword Tracking & Distribution: ClickRank.ai also helps with keyword management. From the Performance section, you can easily add a keyword to your tracking list or jump to optimization suggestions for that keyword ( It includes a Keyword Distribution feature that shows how your keywords are spread across different ranking tiers (for example, how many keywords you have in positions 1-3, 4-10, 11-50, etc.)
This is a great way to monitor overall ranking improvements, you want to see more keywords moving into that top 10 range over time. If you notice many keywords stuck on page 2 (positions 11-20), that might prompt an action to give those an extra push (perhaps through content refreshes or link building).
Integration with Google Data: During onboarding, ClickRank connects with your Google Search Console, which allows it to regularly fetch the latest performance data for your site. This means the numbers you see in ClickRank’s dashboard are up-to-date and consistent with what Google is seeing, but presented in a more marketer-friendly manner. It basically overlays a layer of intelligence and usability on top of raw Google data.
Performance Alerts and Reports: ClickRank.ai can alert you to significant changes in your SEO metrics. For example, if your total clicks drop significantly week-over-week, you could get a notification to investigate.
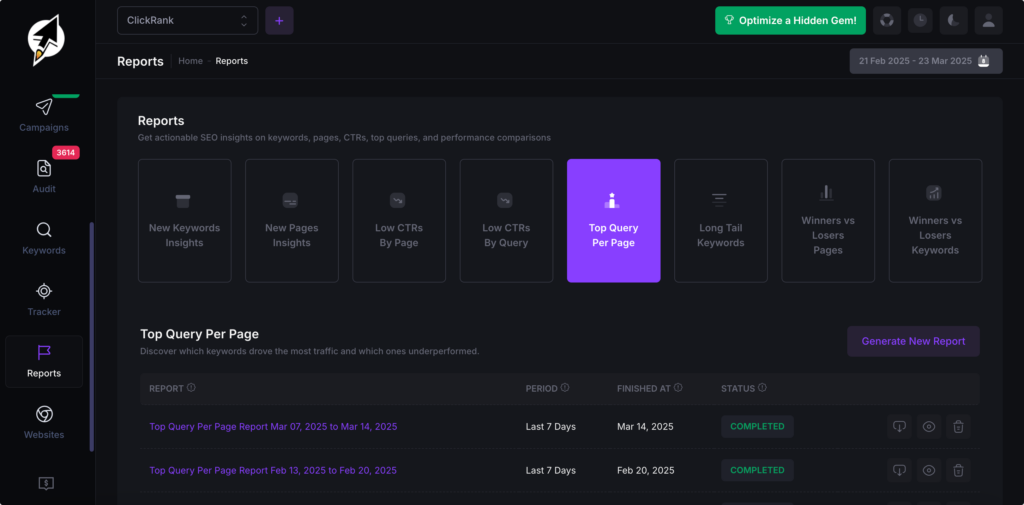
ClickRank also provides reporting feature (there’s a Reports section in the platform) where you can generate white-label reports of your key SEO metrics for stakeholders.
This ties back to the need for SEO reporting metrics you can automate and customize how you present metrics like traffic, rankings, and conversions through ClickRank’s reporting tool, saving you the manual effort of compiling data.
Using ClickRank to improve SEO: Beyond tracking, ClickRank.ai’s integration of metrics and action makes it a tool for improvement. If you see, for instance, a page with high impressions and low CTR, you can edit the snippet.
If you see a keyword rising in rank, you might decide to create more content around that topic to capture even more traffic. ClickRank basically helps you monitor SEO performance continuously and easily spot those “hidden gems” or opportunities in your data that might be missed if you weren’t looking carefully.

It’s like having an SEO co-pilot highlighting, “Hey, here’s a keyword with a lot of impressions but low traffic, maybe optimize it” or “These pages gained clicks this month – maybe create more like these.”
To get started with ClickRank.ai, you simply sign up and go through a quick onboarding process. (If you haven’t tried it yet, you can visit the ClickRank.ai onboarding page to create an account and connect your site.) Once connected, the platform begins pulling in your SEO performance data and you can immediately see dashboards like the one above populating with your site’s metrics.
Internally, ClickRank’s help center has detailed articles on using the Performance features, for example, guides on Analyzing Performance by Page or Tracking Keyword Distribution. These can help you get the most out of the tool’s capabilities.
But the interface is quite intuitive: you use the left-hand menu to navigate to Performance, then explore Pages, Queries, Countries, Devices, or Dates as needed. From there, it’s about interpreting the data (with the guidance the platform provides) and taking actions to improve your SEO results.
In summary, ClickRank.ai acts as a centralized hub for tracking SEO performance and a proactive assistant for improving it. It combines the functions of multiple tools, analytics, rank tracker, site auditor into one tailored for marketers who want insights and the ability to implement changes swiftly.
If you’re managing SEO for a website and find yourself juggling spreadsheets and various tool dashboards, ClickRank can simplify your workflow significantly. It’s especially useful for marketers who may not have a full SEO team – it surfaces recommendations that can guide your SEO strategy.
(To try ClickRank.ai, you can sign up on the onboarding page and connect your Google Search Console. The platform will walk you through setting up your site and within minutes you’ll have your SEO performance data at your fingertips.)
Here’s a clear, easy-to-use table summarizing the most important SEO performance metrics and recommended tools to track them effectively:
Full Recap on What SEO Metrics To Track
| SEO Performance Metric | Why Track It? | Tools to Use |
|---|---|---|
| Organic Traffic (Clicks & Visits) | Measures how effectively your SEO efforts attract visitors through search engines. | Google Search Console, Google Analytics 4, ClickRank.ai, Semrush |
| Keyword Rankings | Shows how well your pages rank for targeted keywords, indicating visibility. | Google Search Console, Semrush, Ahrefs, ClickRank.ai |
| Organic Impressions (Search Visibility) | Reflects how often your content appears in search results. | Google Search Console, ClickRank.ai |
| Click-Through Rate (CTR) | Helps gauge how appealing your content is in search results and snippet effectiveness. | Google Search Console, ClickRank.ai |
| Conversions & Goal Completions | Ties SEO efforts to actual business outcomes and ROI. | Google Analytics 4, Google Tag Manager, Looker Studio |
| Bounce Rate & User Engagement | Indicates content relevance and user satisfaction with your pages. | Google Analytics 4, ClickRank.ai |
| Backlinks & Domain Authority | Measures site authority, which directly impacts rankings. | Ahrefs, Semrush, Moz, Majestic |
| Technical SEO & Core Web Vitals | Ensures optimal website health and performance, crucial for user experience and rankings. | Google Search Console, PageSpeed Insights, Lighthouse, Semrush, Ahrefs |
Conclusion
Measuring SEO success comes down to consistently tracking the metrics that align with your goals. By focusing on the most important SEO metrics – from rankings and traffic to engagement and conversions – you ensure that your SEO efforts are data-driven and impactful. We’ve discussed how to measure SEO performance using a variety of tools and metrics. Remember, the key is not to drown in data, but to zero in on the indicators that matter for your business.
Regularly reviewing your SEO KPIs (your indicateurs SEO) allows you to celebrate the wins (like a boost in organic traffic or a jump in keyword rankings) and quickly address the losses (such as a drop in CTR or a technical issue affecting site health). It’s this ongoing monitoring and tweaking that leads to sustained SEO growth. As you implement changes – whether it’s optimizing content for a higher CTR, building quality backlinks, or improving page speed – watch the corresponding metrics to measure the impact. This closed-loop process of optimization and measurement is the essence of successful SEO management.
Finally, leverage the tools at your disposal. Google’s free tools provide a wealth of information, and advanced platforms like ClickRank.ai can centralize and streamline your SEO tracking. Using an all-in-one solution can save you time and help uncover insights you might miss when piecing data together manually. When you can see all your SEO performance metrics in one view, patterns emerge more clearly – and you can act on them faster.
In the fast-paced world of search engine optimization, those who measure effectively are the ones who can adapt and improve. By tracking the SEO performance metrics outlined in this article and utilizing the right tools, you’ll be well-equipped to monitor SEO performance, demonstrate the value of your work through solid data, and continuously refine your strategy for better results. Now it’s your turn: put these practices into action, and watch your SEO performance climb!